The Prozone phenomenon, also known as the hook effect, occasionally occurs in biochemical analyzers, most commonly with IgG in patients with long-standing multiple myeloma. When you issue a normal report, the patient may immediately question it. The official definition is: a phenomenon of antigen-antibody reaction. In quantitative antigen detection of antibodies, if the antibodies are in excess, the formed immune complexes may actually decrease, leading to a lack of agglutination.
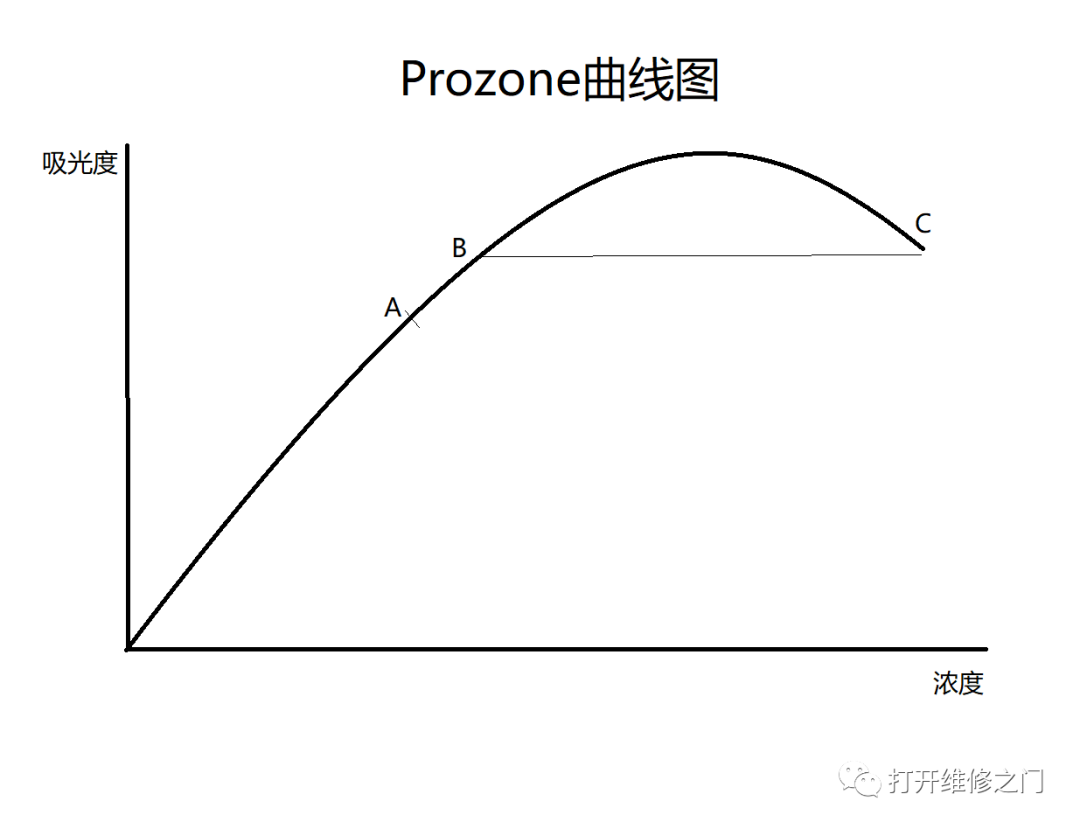
First, analyzing from the calibration curve, point A is the upper limit of the linear range, and the absorbance at point C is the same as that at point B. In fact, the concentration at C is very high, but the reported result may be B. However, since both B and C exceed the upper limit of the linear range, any results exceeding this limit should be diluted and rechecked to avoid erroneous results.
However, in reality, we encounter situations like this: for example, IgG, where A is the normal value range and B is the upper limit of the linear range. Of course, this is an extreme example; the reported result for a specimen with extremely high prezone actually falls within the normal value range. Besides IgG, the immunoturbidimetric assay for urinary microalbumin can also exhibit such behavior.
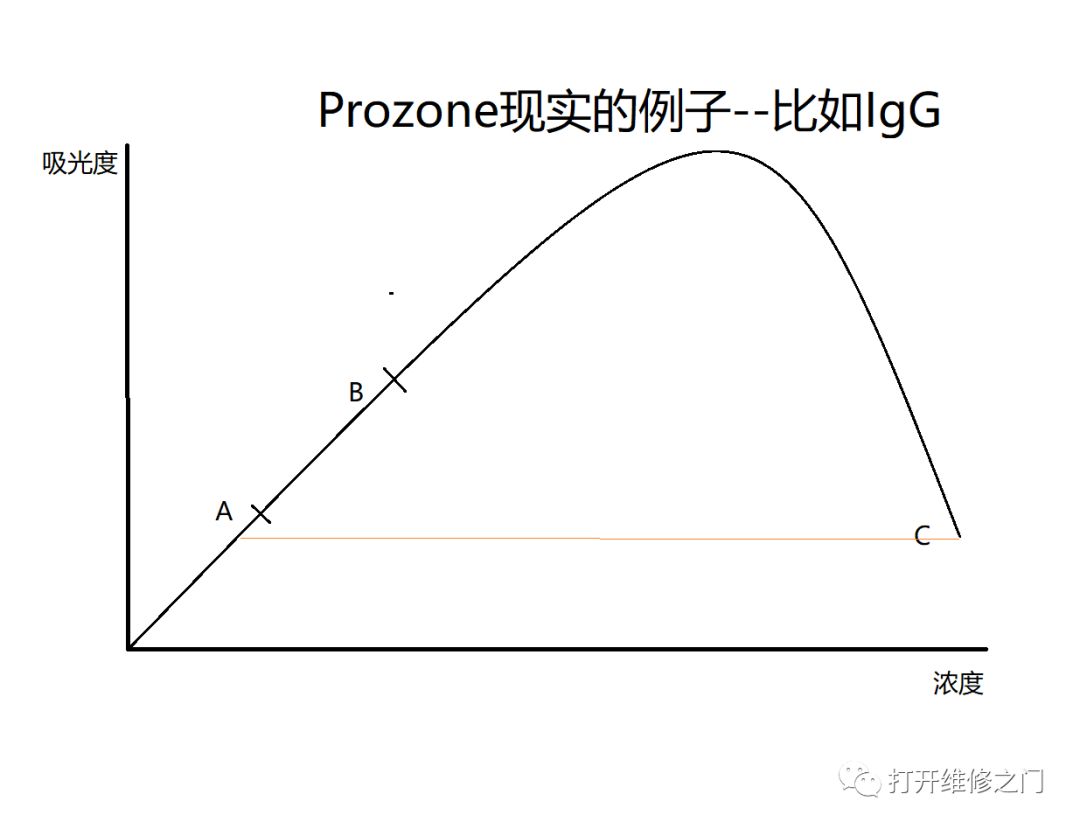
The simplest way to handle this is to ensure that the linear range B and the prezone C do not overlap. If necessary, B can be narrowed. Of course, the above is a very extreme example.
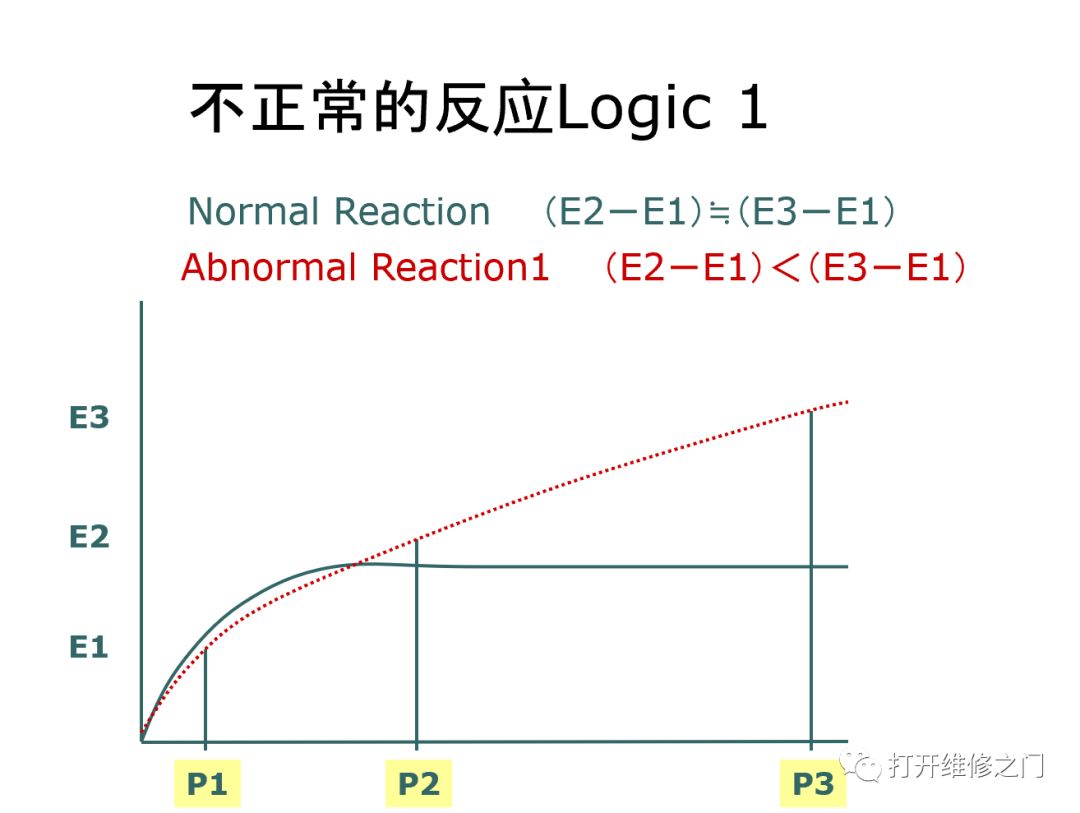
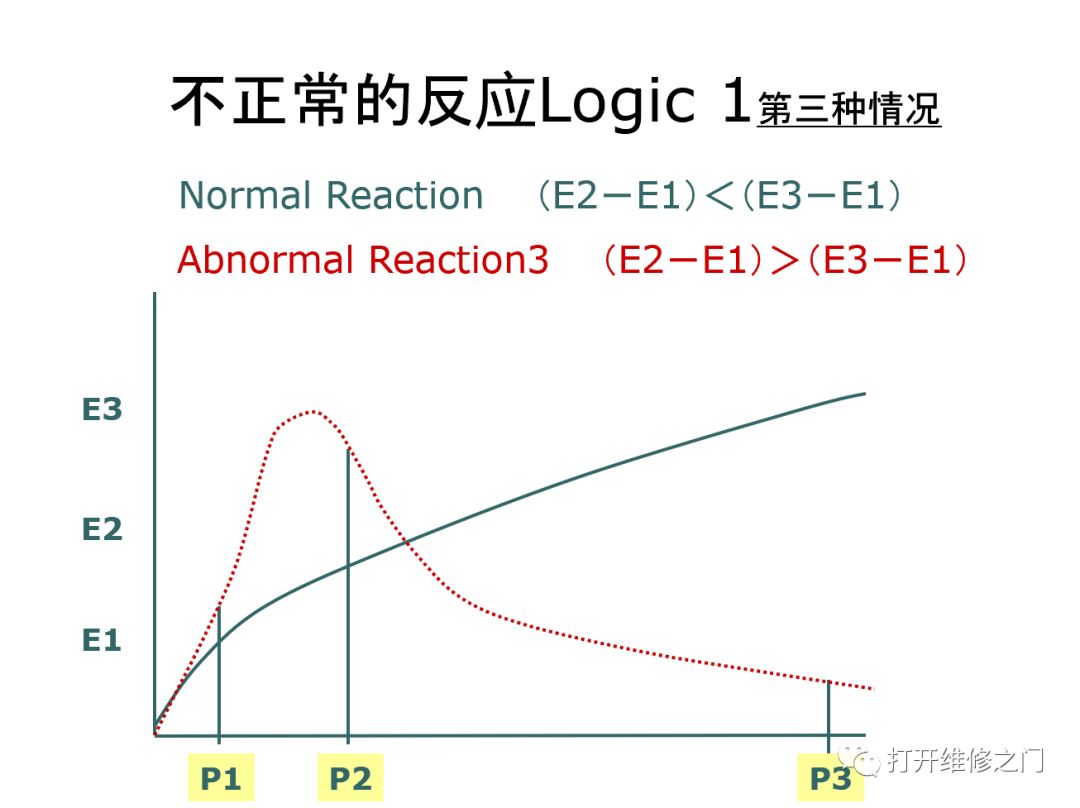
So what can we do? Right, we can set the Prozone parameters to alert when a specimen shows a prezone reaction (the AU instrument will alert with “Z” or “&” when prezone occurs). When staff see the alert, they can dilute and recheck, and this problem can be easily resolved. Below we analyze three models of prezone: the first logical model’s first case shows that the normal reaction curve is similar to endpoint method reactions reaching the endpoint, while the specimen with prezone cannot finish reacting and continues to react (the red line indicates this):
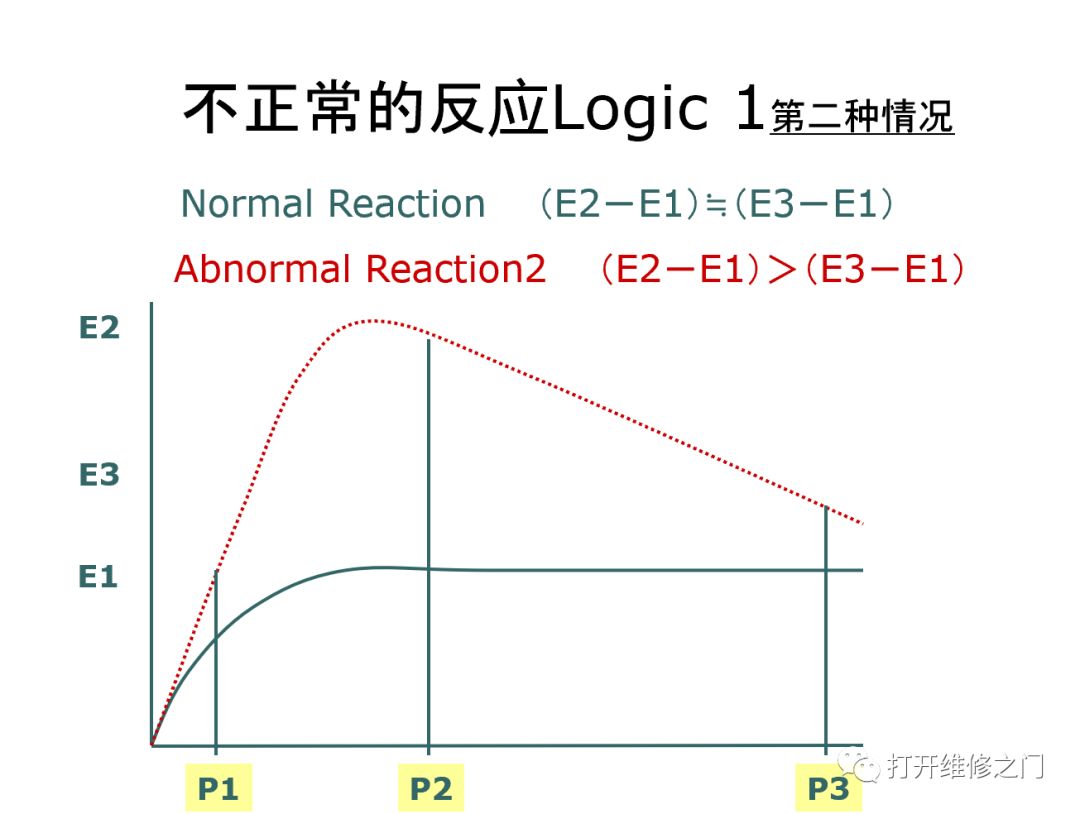
Below is the second case of the first logical model: the normal reaction curve is similar to the endpoint reaction curve reaching equilibrium, while the reaction curve of the prezone reaction first rises and then falls, but the final absorbance is higher than that in the normal case.
Below is the third case of the first logical model: the normal reaction curve gradually rises, while the reaction curve of the prezone first rises and then falls, but the final absorbance is lower than that in the normal case.
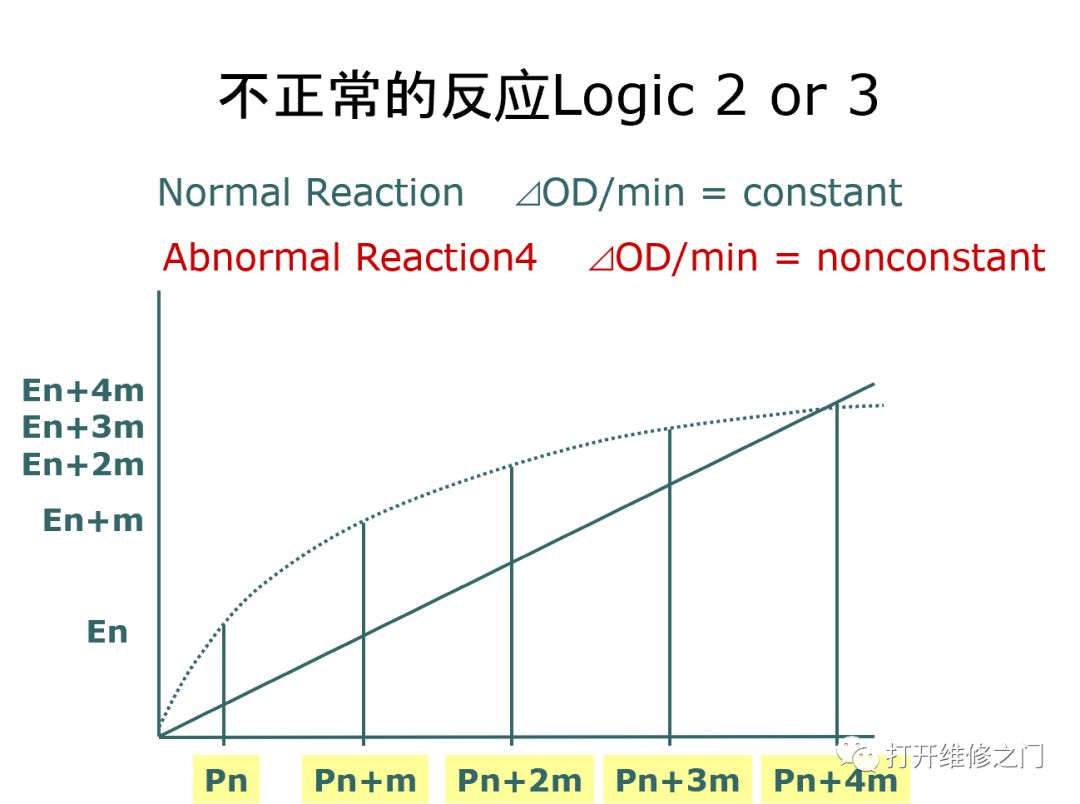
Below are the situations of Logic 2 & Logic 3: the normal reaction type is the rate method (rate turbidimetric method), and the occurrence of prezone shows substrate depletion, resembling a slower endpoint method reaction.
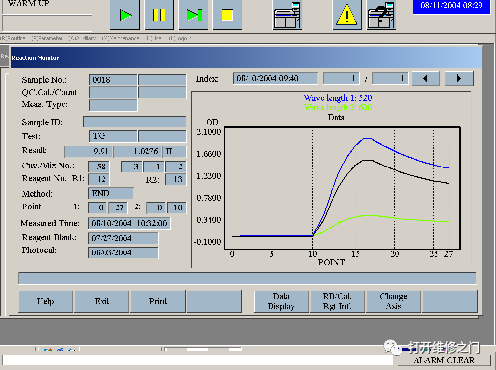
The above briefly introduces three logical situations; now we can match them to our cases. In clinical work, we find that if the glucose oxidase GLU concentration is particularly high and TG is particularly high, the second case of Logic 1 may occur:
At the request of the client, we analyzed the prezone situation of myoglobin on the AU biochemical analyzer:
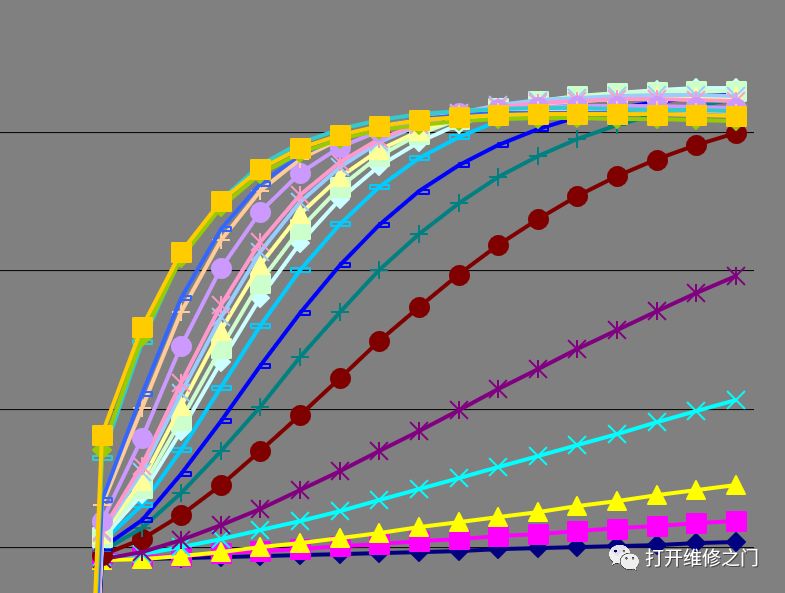
A total of 20 reaction curves, from low to high, initially showed linear reactions using the two-point method. As the concentration increased, non-linear reactions appeared. I successfully solved this problem using Logic 3, allowing the actual concentration exceeding the linear range to report results lower than the linear range, triggering the alert “Z”. During testing, even a concentration of 5000 would trigger an alert, as no higher concentration specimens were available for testing.
Below is the situation for urinary microalbumin, with a nominal upper limit of the linear range of 500 mg/L:
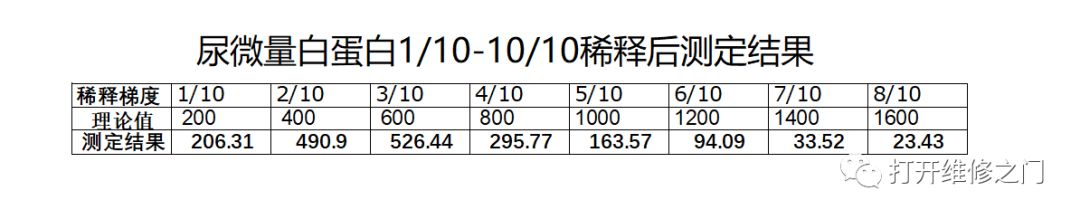
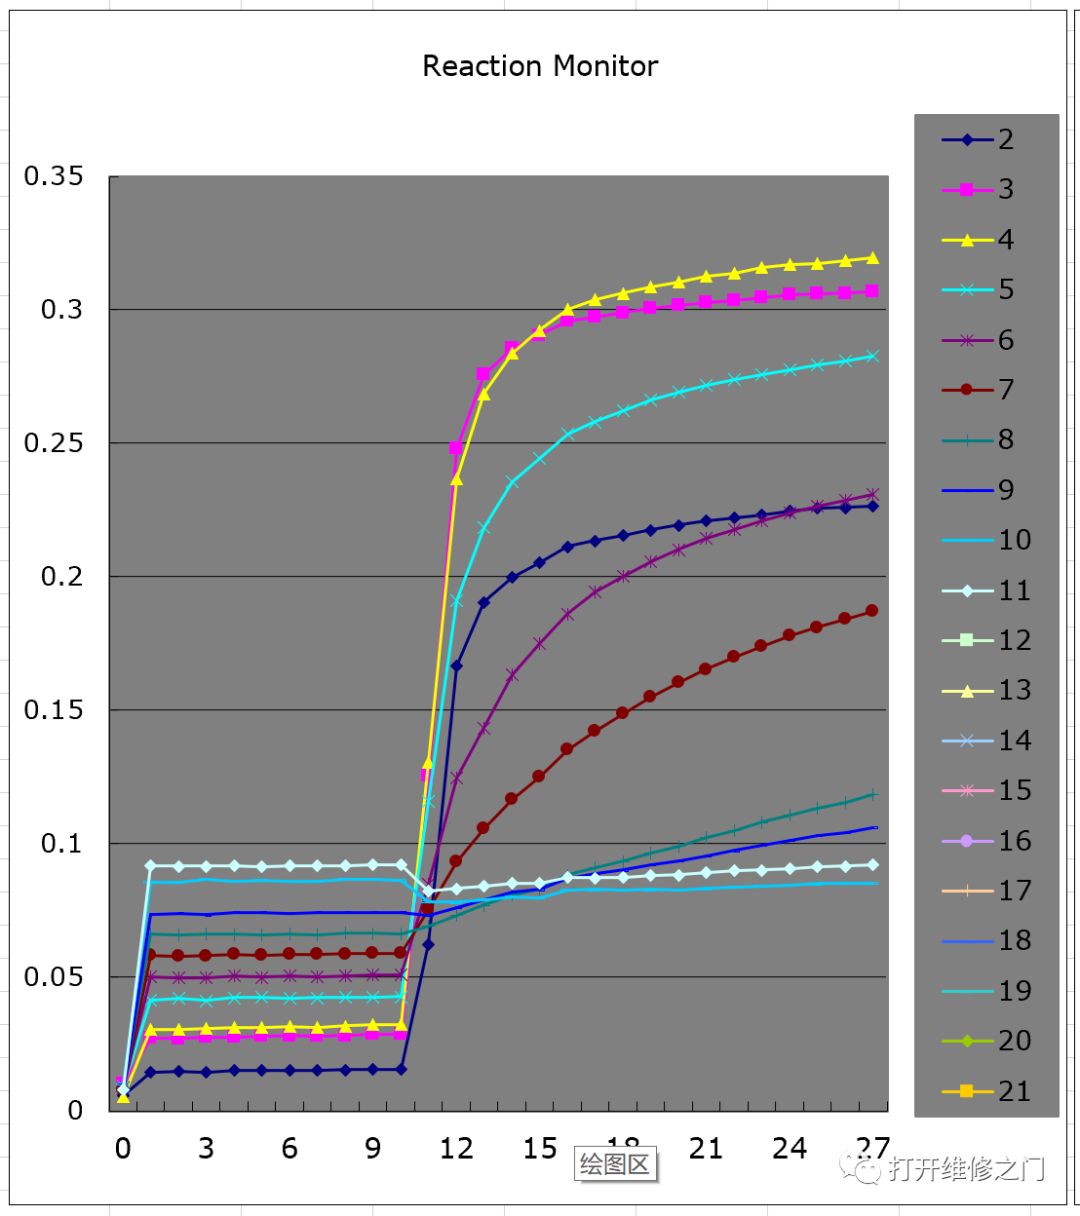
Chaotic and irregular, this situation cannot be resolved using the Prozone method.
In summary: Setting parameters for third-party reagents for prezone checks is very challenging (highly technical). Only when there are characteristic differences between the normal reaction curve and the prezone specimen’s reaction curve can there be a solution. For example, the urinary microalbumin case mentioned earlier has no solution. Teachers facing difficult problems are welcome to communicate with me, and we can solve this problem together! Additionally, we welcome full cooperation with third-party reagent companies.
Data for this article was provided by Jiukang Company / Lingyuan People’s Hospital, for which we express our gratitude!
Source: Open the Door to Maintenance
Follow us