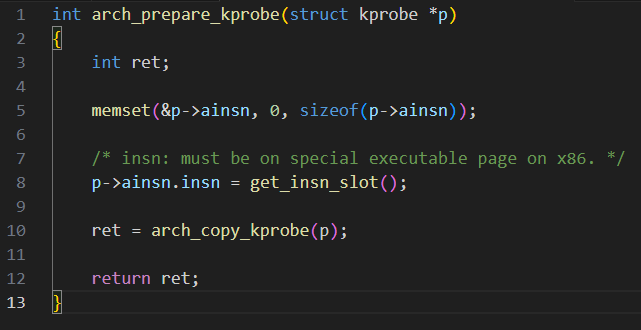
Kprobe is a powerful debugging and tracing tool in the Linux kernel that allows developers to dynamically insert breakpoints at almost any instruction in the kernel, enabling the collection of debugging and performance information without the need to reboot the system, modify the kernel source code, or recompile the kernel. In the previous article, Introduction to Kprobe in the Linux Kernel, we introduced the basic usage of Kprobe. In this article, we will analyze the source code of Kprobe in the Linux kernel and clarify the basic principles of Kprobe. Before analyzing the principles of Kprobe, let’s first review the usage of Kprobe: 1. Define a struct kprobe variable and set the symbol_name and offset members of the kprobe structure. The member symbol_name is the name of the target function to be probed, and offset is the offset of the probe point relative to the starting address of the target function. If not specified, it defaults to 0, meaning the probe point is at the starting address of the target function. 2. Write the pre handler and post handler callback functions for Kprobe and assign them to the pre_handler and post_handler members of the kprobe structure. The pre_handler callback function will be called before the kernel executes the instruction at the probe point, and the post_handler callback function will be called after the kernel has executed the instruction at the probe point. 3. Use register_kprobe to register the initialized kprobe structure with the kernel. 4. When the Kprobe is no longer needed, call the unregister_kprobe function to unregister the kprobe from the kernel. Next, we will analyze the implementation of Kprobe along two main lines, starting with the register_kprobe function. Below is the simplified code of the register_kprobe function, retaining only the core code. This function first obtains the address of the probe point in the kernel, addr, using the user-defined symbol_name and offset, and records this address in the addr member of the kprobe. Then it calls the prepare_kprobe function to prepare the Kprobe, which we will analyze later. Next, it inserts the kprobe structure into a global hash table (kprobe_table) using the probe point address addr as the key. The kprobe_table records all currently registered Kprobes in the kernel. Finally, it uses the arm_kprobe function to install this Kprobe, which we will also analyze later.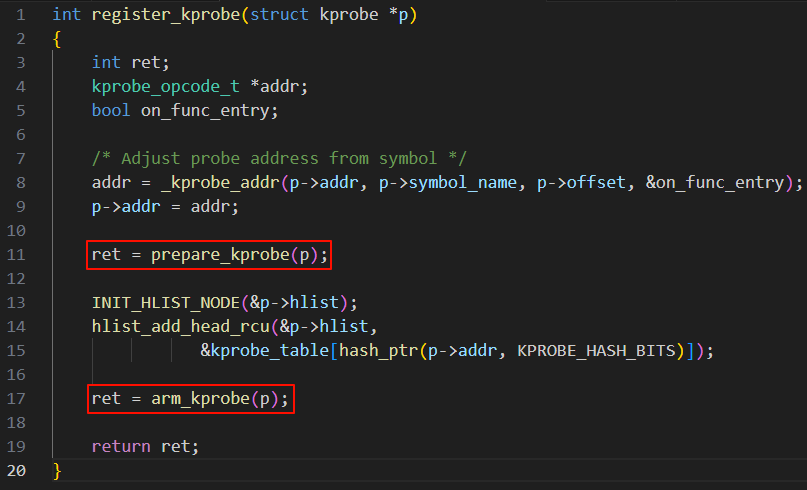 Now let’s look at the implementation of the prepare_kprobe function. This function is quite simple and contains two branches. The first branch is for optimizing Kprobe using ftrace, which we will cover in a separate article. This article focuses on the second branch, which is the arch_prepare_kprobe function. This is an architecture-specific function that is implemented differently across architectures. We will analyze the implementation of this function using the x86 architecture as an example. The arch_prepare_kprobe function on the x86 platform is implemented as follows, with the specific path being arch\x86\kernel\kprobes\core.c. I have retained only the core code for easier understanding. The kprobe structure has a member called ainsn, which is a member of the arch_specific_insn structure used to store the original instruction at the probe point. This structure is also implemented differently across architectures due to variations in instruction formats. In the arch_prepare_kprobe function, the ainsn member of the kprobe is first zero-initialized, and then a block of executable memory is allocated to store the original instruction at the probe point. Remember this memory address stored in the ainsn.insn member, as it will be important later. Finally, the arch_prepare_kprobe function calls the arch_copy_kprobe function, indicating that the preparation of Kprobe is mainly handled by arch_copy_kprobe.
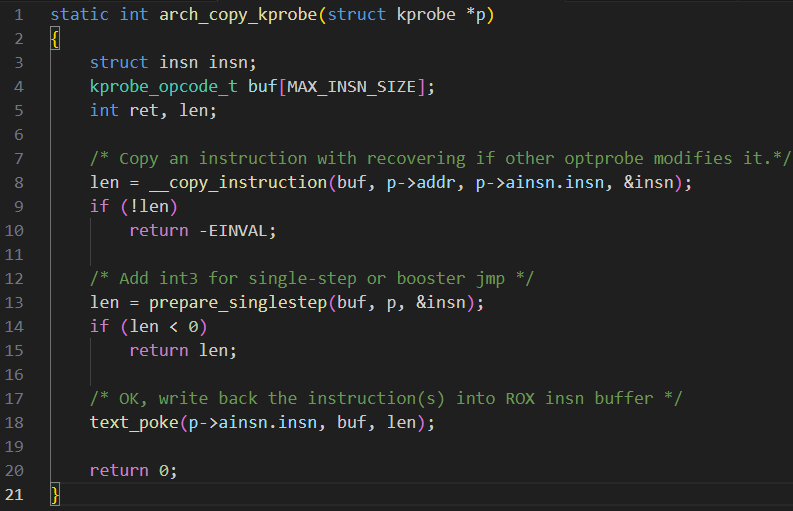
 The core code of the arch_copy_kprobe function is as follows. This function first uses the __copy_instruction function to copy the instruction at the Kprobe probe point into a temporary buffer and stores the decoded information of that instruction (such as the instruction length) in the insn structure variable.
 After the arch_copy_kprobe function copies the original instruction at the probe point, it calls the prepare_singlestep function to process the original instruction. Let’s see how it works. This function has two branches. The first branch is mainly optimized for cases without a post_handler. If there is no post_handler, the kernel can continue executing the instructions after the probe point once the instruction at the probe point has been executed. Therefore, what this branch does is add a jump instruction after the backed-up original instruction at the probe point, directly jumping to the instruction following the probe point. If this Kprobe has a post_handler or cannot be optimized for cases without a post_handler, the prepare_singlestep function will take the second branch, adding an int3 instruction after the backed-up original instruction. The int3 instruction is a breakpoint debugging instruction on x86 CPUs, and when the CPU encounters this instruction, it will jump to the kernel’s breakpoint handling function. At this point, you can probably guess that there is code to handle Kprobe in the kernel’s breakpoint handling function.
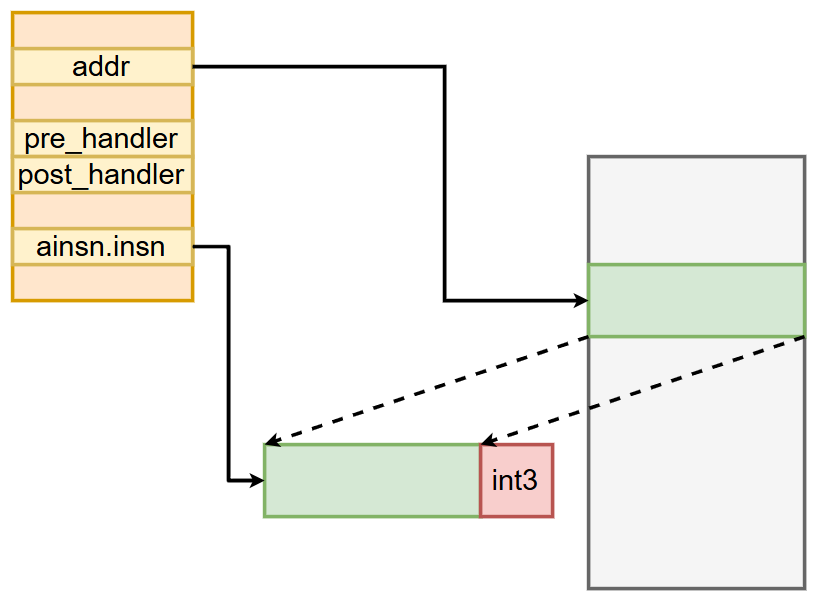
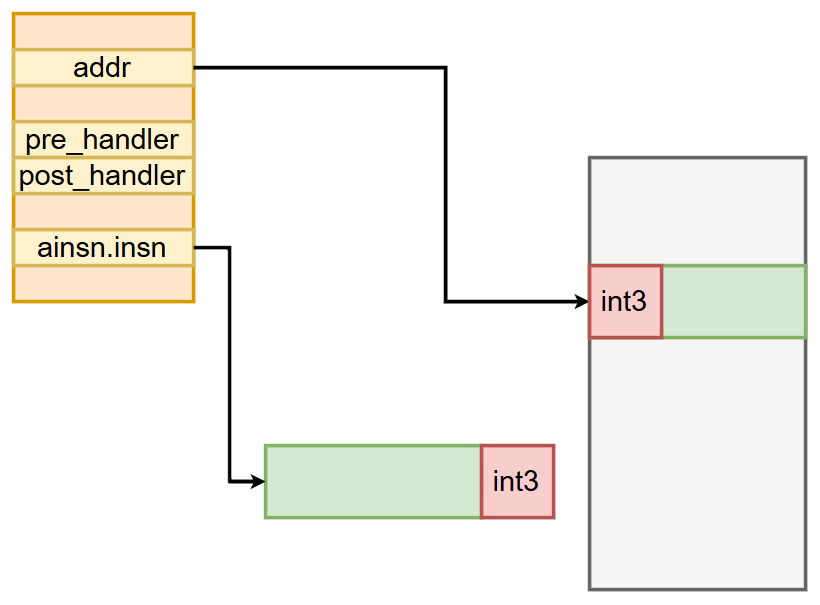
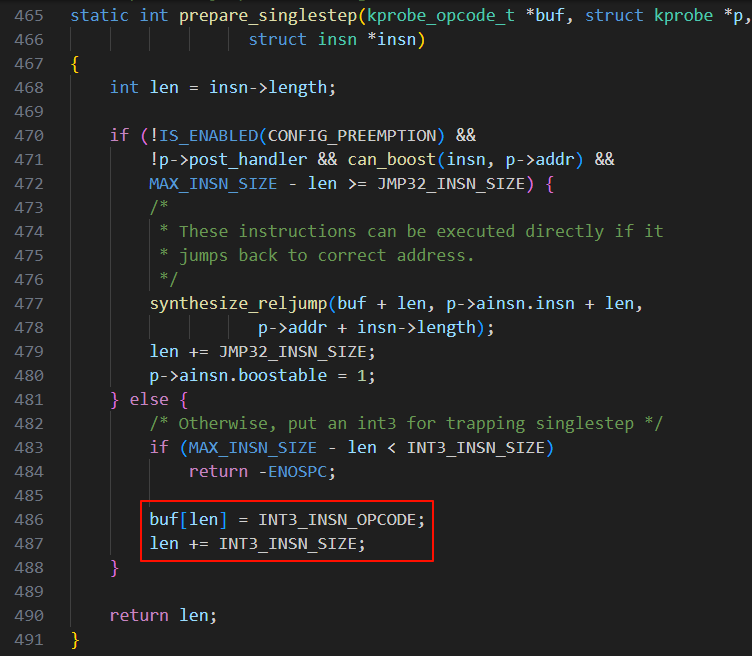 After analyzing the prepare_singlestep function, let’s return to the arch_copy_kprobe function and continue looking down. Next is a call to the text_poke function, which is specifically used in the Linux kernel to copy or modify functions in the code segment. We will not analyze this further; its role here is to copy the instructions from the temporary buffer buf into the kprobe member ainsn.insn. Remember the ainsn.insn? This is the block of executable memory allocated earlier to store the original instruction at the probe point. In fact, what is being copied into the kprobe’s ainsn.insn is not only the original instruction at the probe point but also an int3 instruction placed there by the prepare_singlestep function. At this point, the analysis of the prepare_kprobe function is basically complete. I have drawn a diagram to represent the state of the kprobe structure and the target function at this moment. You can see that the instruction at the probe point has not yet been modified, but its content has already been backed up to the kprobe structure’s ainsn.insn member, and a breakpoint debugging instruction int3 has been added after the original instruction.
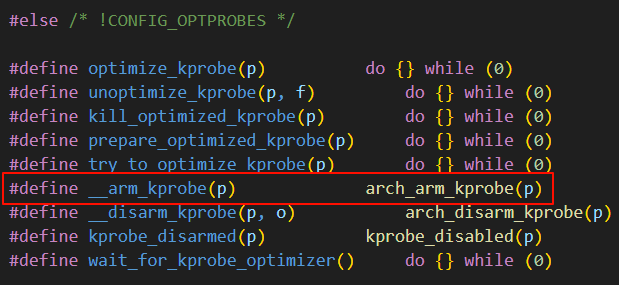
 Next, we will analyze the arm_kprobe function in the register_kprobe function. The first if branch of this function handles the case of optimizing Kprobe using ftrace (which we will not discuss in this article). This time we focus on the subsequent branch, which is the implementation of __arm_kprobe. If we ignore the OPTPROBES optimization case (which we will discuss later), this is a macro that expands to the function arch_arm_kprobe.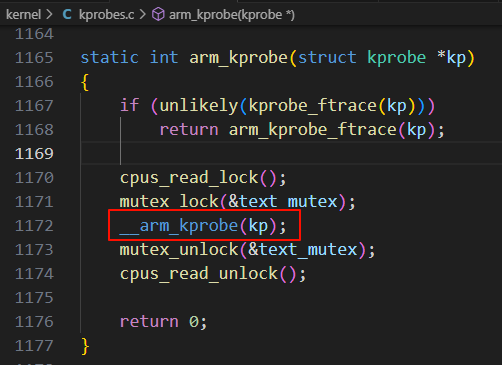
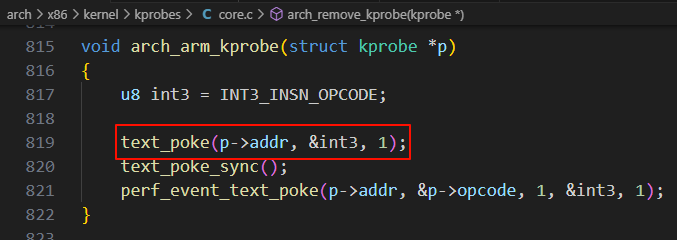
 The arch_arm_kprobe function is also architecture-specific, and its implementation on x86 is as follows. You can see that this function uses text_poke to modify the first byte of the original instruction at the probe point, changing it to the breakpoint debugging instruction int3.
 At this point, the analysis of the register_kprobe function is complete. The state of the kprobe structure and the target function can be represented by the following diagram. At this moment, the first byte of the original instruction at the probe point has also been changed to the breakpoint debugging instruction.
 Next, we will analyze the second line of Kprobe implementation: the kernel breakpoint handling function’s processing of Kprobe. When the kernel executes the target function at the probe point, the CPU will hit the int3 instruction set there, and then the CPU will jump to execute the kernel’s breakpoint handling function. Below is the stack trace I captured when the pre_handler was called, showing that it was called by the function kprobe_int3_handler, which is the kernel breakpoint handling function called by asm_exc_int3 to handle Kprobe.
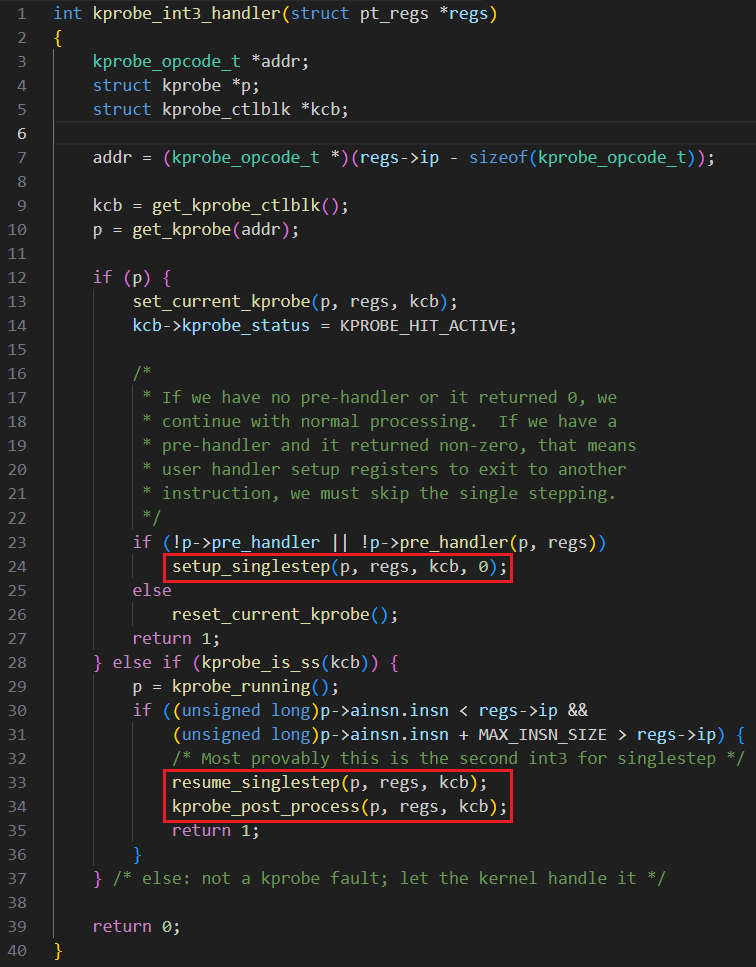
 Now let’s look at the implementation of the kprobe_int3_handler function, where we will only retain the core code. If the breakpoint event is triggered by the int3 instruction at the probe point, the addr calculated by this function will be the address of the probe point (regs->ip is the address of the instruction following the int3 instruction that triggered the breakpoint event, minus one byte for the int3 instruction gives the address of the probe point). The function get_kprobe is used to look up the previously mentioned kprobe_table hash table based on this address, allowing us to obtain the corresponding kprobe structure. Then it enters the first branch of the kprobe_int3_handler function, calling the pre_handler of that Kprobe (if the user has set a pre_handler). After executing the pre_handler, if it returns 0 (indicating that the post_handler should be executed), the function will call setup_singlestep.
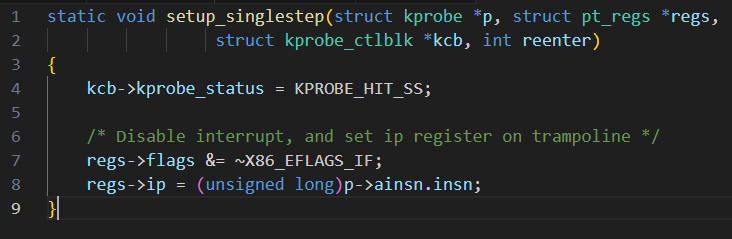
 The setup_singlestep function essentially does one thing: it sets the value of the instruction pointer register in the current context’s register structure to the address of the original instruction backed up by the kprobe, ainsn.insn. When this breakpoint handling function exits, the kernel will restore the register values to those recorded in the current context, meaning the value of the CPU’s instruction pointer register will change to the address of the original instruction backed up by the kprobe, and then it will execute this instruction. However, don’t forget that this instruction is followed by an int3 breakpoint debugging instruction, and when the CPU finishes executing the backed-up original instruction, it will hit this int3 instruction, causing the CPU to jump back to the kernel breakpoint handling function again.
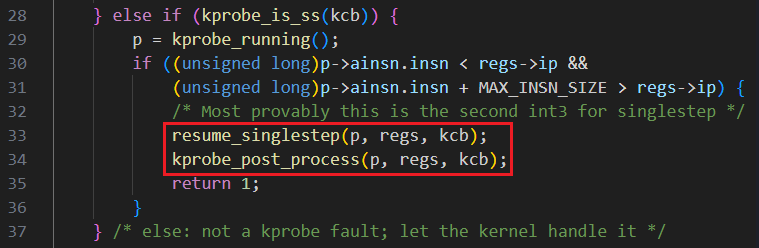
 When the CPU jumps back into the kprobe_int3_handler function again, the addr calculated this time points to the int3 instruction in the backed-up instruction in the kprobe structure’s ainsn.insn. Therefore, the function get_kprobe will not find the corresponding kprobe structure in the kprobe_table hash table (because this address is a private temporary address of the current Kprobe and cannot be registered). The kprobe_int3_handler function will then take its second branch, where it mainly does two things. The first is to call the resume_singlestep function.
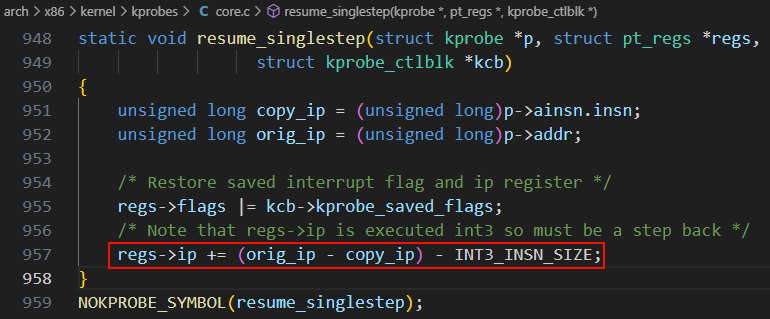
 The code of the resume_singlestep function is as follows. It mainly calculates the value of the instruction pointer register when this breakpoint handling function exits. The current value of regs->ip is the address of the instruction following the int3 instruction that triggered the breakpoint event, which is p->ainsn.insn + the length of the original instruction at the probe point + the length of the int3 instruction. Using the variables in this function, this value is copy_ip + the length of the original instruction at the probe point + INT3_INSN_SIZE. Therefore, the final calculation gives regs->ip = (copy_ip + the length of the original instruction + INT3_INSN_SIZE) + (orig_ip – copy_ip) – INT3_INSN_SIZE = orig_ip + the length of the original instruction, which is the address of the instruction following the probe point. Thus, when this breakpoint handling function exits, the CPU will jump to the instruction following the probe point for execution, restoring the original execution flow of the target function.
 The second thing the second branch of the kprobe_int3_handler function does is call the kprobe_post_process function, which, as the name suggests, mainly executes the Kprobe’s post_handler. We will not go into detail here. After the kprobe_int3_handler function completes these two tasks, when it exits, the kernel breakpoint handling function will restore the register context, and at this point, the regs->ip has already been modified to the address of the instruction following the probe point. Therefore, after restoring the context, the CPU will jump to the instruction following the probe point for execution, restoring the original execution flow of the target function. I have illustrated this entire process in the diagram below.
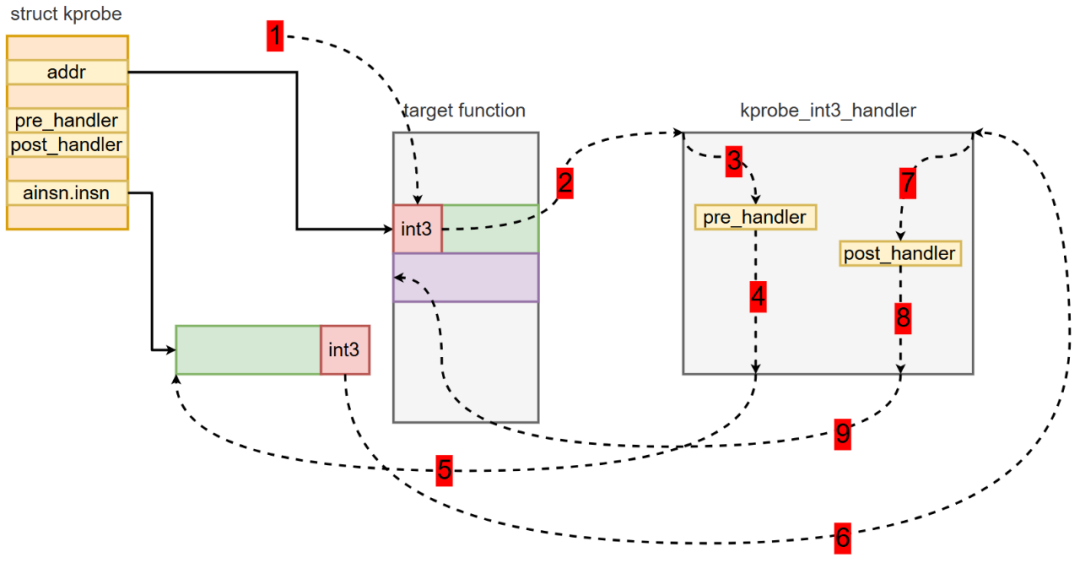 As you can see, the entire process requires two entries into the kernel breakpoint handling function, which means four context switches (two in and two out), and the execution of the original instruction at the probe point still occurs in a “sandbox” (kprobe.ainsn.insn), which is not conducive to CPU instruction cache hits. Due to various performance issues with this basic implementation, clever Linux kernel developers have devised methods to optimize Kprobe performance, which we will cover in a separate article.