
This article is reprinted from the “Petrochemical Automation” magazine, Issue 2, 2021
The full text is approximately 7190 words, with a reading time of about 20 minutes
A Method for Measuring the Health
and Security of Industrial Control System Networks
XU Zhijie1, ZHU Lingyun2, JIN Xin3
(1. Kenexis Consulting; 2. Beijing Shangde Automation System Co., Ltd.; 3. Liaoning University of Petroleum and Chemical Engineering, School of Information and Control Engineering)
Determinism is one of the main considerations for engineers designing and operating Industrial Control Systems (ICS). ICS must respond to information sent over the network within a certain timeframe; otherwise, the system may become unstable and/or fail. Many factors can affect system determinism, such as the performance of individual devices. While some factors can be considered during system design, interactions within and between systems, as well as security settings, can sometimes be difficult to determine in advance. Therefore, it is necessary to measure and collect data during testing and operation to assess the system’s determinism.
Currently, many companies in China still have misconceptions about ICS security: they believe that as long as the ICS is not connected to the internet, hackers cannot attack it. In fact, many industrial control networks within enterprises are “open”, and there is no effective isolation between systems. Although protective facilities/software are installed on the internal network and various cybersecurity technologies are implemented, with the advancement of information technology and the acceleration of industrialization, information security issues from factory information networks, the internet, and other factors are gradually spreading to control systems, posing a direct threat to the safety and stability of factory production control.
1 Common Network Security Monitoring Methods
1.1 Device Reporting Method
ICS network protocols have evolved from older, serial or bus-based fieldbus networks. Although they can currently operate over Ethernet and Transmission Control Protocol (TCP)/User Datagram Protocol (UDP)/Internet Protocol (IP) networks, most interactions between devices on the network are based on such fieldbus systems. When devices on the fieldbus need to connect to the network through some form of bus, the number of communication flows, message lengths, and periodicity must be limited. This has led to the emergence of various methods to restrict external traffic on the network.
One method is to have complex controllers act as hosts on the network, while input/output (I/O) devices act as slaves. The host can command the slave to perform certain operations or request information from the slave over the network. The slave will not communicate unless specifically requested by the host.
Another method is “periodic reporting”, which allows I/O devices and controllers to interact in a peer-to-peer manner. The controller and I/O devices routinely exchange signals when initiating communication flows, establishing parameters for the communication flow, including the information contained in the communication messages and the expected periodicity. I/O devices and controllers operate independently and monitor for errors in the communication flow. If an error occurs during communication, most controllers can re-establish the communication flow using their internal methods.
The third method is called “exception reporting”, which is somewhat between master/slave reporting and periodic reporting. In this method, the controller can communicate with the I/O devices periodically to ensure that both devices are still operational, referred to as a “heartbeat”. Generally, the “heartbeat” has a relatively low periodicity. The I/O devices remain mostly dormant outside of these “heartbeat” messages, waiting for certain conditions to be met. When such conditions are met, for example, when sensor measurements exceed a certain range, the I/O device will send a message to the controller indicating that an exception has occurred.
1.2 Comparison of Positive and Negative Indicators
Regarding indicator reporting, it can be either positive or negative. Positive indicators refer to specific values (Boolean, integer, floating-point, etc.) reported as capable of representing a physical quantity. Positive indicators allow values to be used as inputs for some processes by another device and/or system (e.g., control functions).
For process control cycles, positive indicators typically enter the control loop and are used as process variables in each cycle. When checking each control cycle, negative indicators are not actively used unless certain specific conditions are met. If such conditions arise, negative indicators may cause the system to enter another state or execute different sub-loops in the main control loop. However, during normal operation, control cycles typically do not actively use these indicators.
Safety indicators are usually reported as negative indicators. Antivirus software continuously checks the system in the background but typically remains “silent” until an error occurs. If a known virus signature is detected, it will alert the user that there is a problem. Unless the user specifically checks the status of the software itself, antivirus software will remain silent. To maintain situational awareness, it is necessary to understand the execution status of the entire system at any given moment, and corresponding trend changes can be established before reaching alarm trigger values.
1.3 Network Security Monitoring and Security Information/Event Management
Network Security Monitoring (NSM) is “the collection, analysis, and escalation of indications and warnings to detect intrusions and respond to them.” NSM represents “a means to find network intruders and take action against them before they can damage the enterprise”. NSM typically involves collecting all available logs and alert information from different sources within the network and analyzing their Indicators of Compromise (IOC), noting that this information may become part of the network communications flow to malicious actors.
NSM is very effective for detecting known and emerging threats because it is not a single product that can be easily defeated. NSM typically collects and integrates information from multiple different sources, forming a better situational awareness. Since NSM is more of a method for monitoring network IOCs, it is more likely to capture attacks when they occur by using a single type of product or technology.
1.3.1 Advantages of Network Security Monitoring
NSM is particularly suitable for large computing environments, where sensors can be deployed at critical points to detect IOCs.
The upper structure of the ICS network is shown in Figure 1. Commercial systems and servers connect to the internet through an enterprise firewall and to the ICS network through another firewall. A demilitarized zone (DMZ) is used to prevent direct communication between the ICS network and the commercial network. ICS servers communicate with servers in the DMZ, and servers in the DMZ communicate with servers in the commercial network.
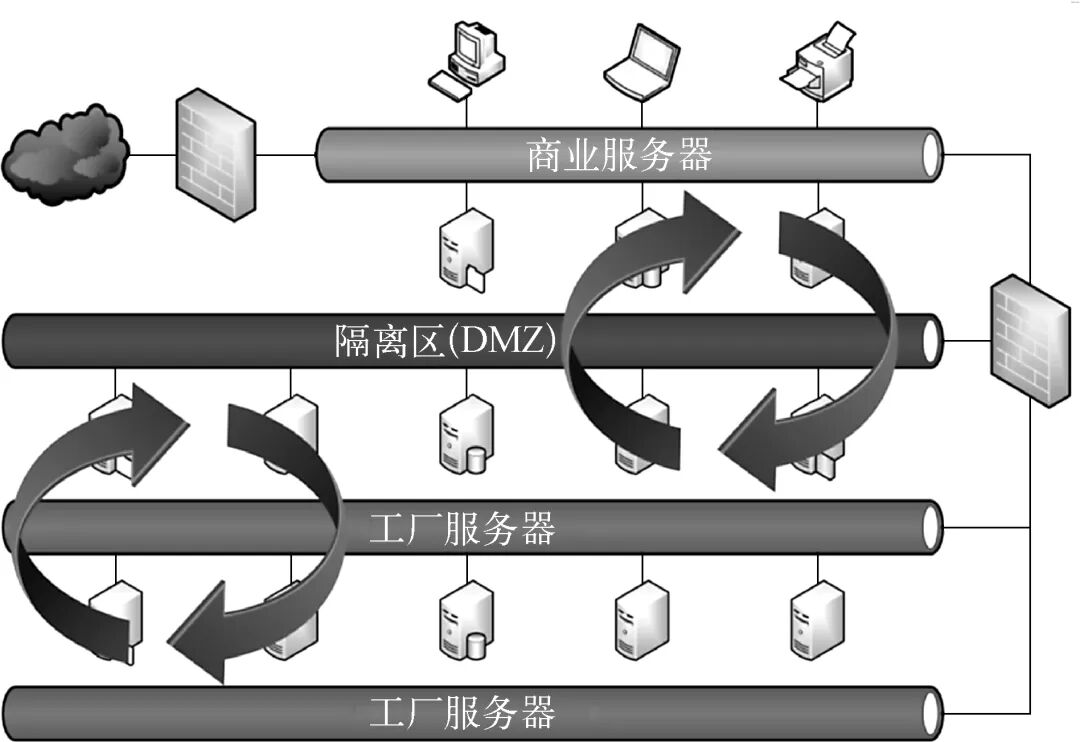
Figure 1 Schematic of the Upper Structure of the ICS Network
Most network communication flows in the upper layer cross network boundaries, using common IT protocols. Generally, systems operating in the upper layer are more common hardware and software platforms, and since communication flows crossing regional boundaries can be monitored, this is very important for NSM. Deploying NSM sensors at regional boundaries allows for convenient monitoring of network communications. Since most traffic in the upper layer crosses regional boundaries, it is easier to monitor and analyze any suspicious situations.
NSM sensors can be more easily deployed on these common hardware and software platforms. Agent software can be deployed on servers to monitor system parameters in real-time without requiring specialized tools or personnel with ICS experience. This allows NSM sensors to integrate across more areas via the network, enabling earlier IOC alerts.
1.3.2 Disadvantages of Network Security Monitoring
While NSM is effective in the upper layer of the network, it is less effective in the lower layer. The lower structure of the ICS network is shown in Figure 2. In this example, there are multiple small work units capable of communicating between Ethernet-based factory control networks and fieldbus networks, representing robotic work units in production devices and remote control stations in a single processing area. One of the work units shown in Figure 2 is located at a remote site capable of communicating with the main device control network via radio lines. The industrial control network also includes operator Human-Machine Interfaces (HMI), engineer workstations, and dedicated control devices.
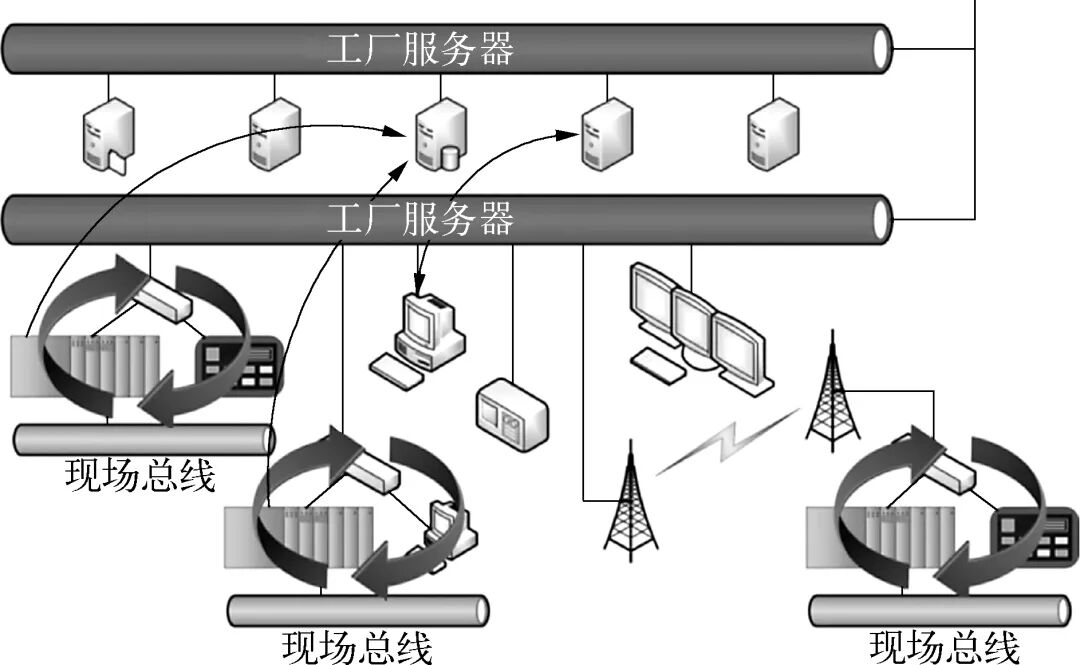
Figure 2 Schematic of the Lower Structure of the ICS Network
Most network traffic in the lower layer tends to “stay” within each work unit, with only a small amount of communication flow able to enter or leave the work unit to reach the main device control network, leading to issues when applying conventional NSM tools and techniques.
Network communications typically “stay” within a certain area and do not cross regional boundaries, meaning that the typical way of deploying NSM sensors in the network needs to be changed. Additionally, to gain situational awareness of network communication flows, dedicated NSM sensors need to be deployed in the network, requiring sensors to be added to each work unit to detect issues when they arise.
Since the hardware and software platforms in the lower layer network are more suited for ICS, new systems need to be deployed in each work unit. Deploying NSM sensors in a facility with many work units can quickly become costly, as each sensor costs at least tens of thousands of RMB. Furthermore, sensors need to communicate back to the main NSM server, which can collect data across the entire network, meaning that the factory control network needs to add a significant amount of network communication flow to maintain continuous monitoring. NSM sensors must be ICS protocol-aware to detect any valuable IOCs, thus increasing the cost and complexity of the system while also limiting the availability of tools and techniques.
2 A Superior Method for Network Reliability Monitoring
2.1 Network Reliability Monitoring for the Lower Layer
The concept of Network Reliability Monitoring (NRM) is essentially similar to NSM. NRM uses data from multiple sources to analyze system performance, with the main difference being that NRM uses proactive measurements of network performance to establish an image and does not require real-time monitoring.
One issue with NSM is whether it can capture IOCs in network communication flows; if one NSM sensor does not report any information, it cannot provide sufficient information about the network, making it impossible to determine whether the system is operating normally.
By using positive indicators from actual network communication flows, NRM can create a network performance image that actively measures different network performance characteristics and uses them to determine whether ICS devices are operating as expected.
While NRM can be used in real-time, this is not typically the case. ICS usually remains unchanged, so testing is conducted periodically or after significant changes. NRM can be used during Factory Acceptance Testing (FAT), Site Acceptance Testing (SAT), and commissioning to establish a baseline signature for the system. Then, during additional testing, new signatures can be compared to the baseline signature, and if changes are observed or anomalies appear in the dataset, root cause analysis is needed to determine the reasons for the changes.
Since NRM does not require real-time monitoring to look for IOCs, it can reduce the number of sensors needed to monitor large networks. A single capture device or a small number of devices can connect to the ICS network at different relatively short intervals (minutes, hours, or days), and these capture devices do not need to communicate with the server over the network, so the factory control network will not be affected by NRM.
2.2 Tools and Techniques for Network Reliability Monitoring
NRM is both simple and complex. In fact, there are many tools available for conducting NRM, with Wireshark being an open-source packet capture and decoder software that has become the de facto standard. Many ICS protocols have developed packet decoders for Wireshark, so there is no need to use specialized software. Wireshark can generate simple spreadsheet files containing different network packet fields.
Wireshark filters communication flows based on certain parameters, and since all packets are interleaved in a single file, it is very important for Wireshark to have the ability to filter communication flows based on certain parameters in network packets. All communication flows should be classified (broadcast, multicast, and unicast) to analyze their performance and reliability. Although generating communication flow filters is often tedious, it can become more complex if proprietary or unknown protocols are not built into Wireshark’s standard packet decoders.
Once the network communication flows are filtered and data files for analyzing the communication flows are generated, the communication flows can be analyzed. Graphical analysis of these communication flows allows engineers to identify anomalies in the data. Periodic jitter analysis of network communication flows is shown in Figure 3. The scatter plot on the right side of Figure 3 shows the relationship between the measured packet interval (MPI) and test time, displaying the relationship between time increments and time.MPI represents the measured time between subsequent packets in the same network communication flow. Since ICS networks and systems heavily rely on deterministic communication between devices, network communication flows need to be as close to “deterministic” frequency as possible. Periodic jitter indicates the variability of actual network communication flow packets relative to the desired packet interval. In Figure 3, the expected packet interval is 10 ms, with an average MPI of 10 ms, and periodic jitter ranging from a minimum to a maximum of about 500 μs.

Figure 3 Example of Periodic Jitter Analysis of Network Communication Flow 1
The left side of Figure 3 shows a data frequency count graph, which can provide some measurement of frequency analysis but is not as complete as Fourier analysis. However, it is sufficient to help engineers understand visible bands in the data. While the graph shown in Figure 3 is quite stable, with most packets appearing in the center and distributed relatively tightly, and no long-term events occurring, not all devices behave this way. Figure 4 shows the network communication flow of another device during a separate test. The average MPI is 1 ms, with periodic jitter of about 210 μs, indicating a good distribution around the average value. The device analysis graph shows a beat pattern occurring approximately every 26 seconds.
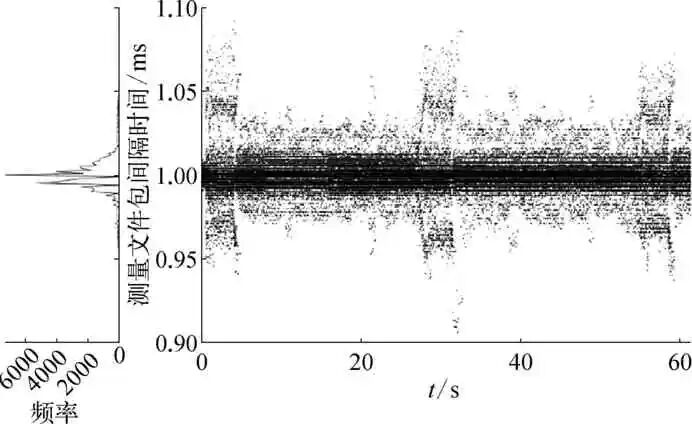
Figure 4 Example of Periodic Jitter Analysis of Network Communication Flow 2
One of the biggest challenges in trying to understand the beat patterns or anomalies observed in the periodic jitter analysis is finding the root cause of the beats or anomalies. Issues with device architecture may include operating system garbage collection, antivirus software checks and updates, and screen operations. Additionally, network infrastructure may also have issues, such as electromagnetic interference (EMI), signal degradation, or corrosion. The ICS environment is not always conducive to wiring and equipment for network infrastructure designed for office environments; sometimes, factors such as heavy machinery, chemicals, and particulates can affect network communication performance. Furthermore, it is also possible that during actual security incidents, beat patterns or anomalies may present IOCs. Without a baseline communication flow for comparison, it is difficult to determine this.
2.3 Baseline Testing
When searching for anomalies in network signatures, developing a good comparative baseline is very important. Due to constantly changing conditions, it may be difficult to adopt a well-designed IT baseline. However, in the ICS environment, this is relatively easy. Systems undergo multiple tests before they begin operation, including FAT, SAT, and commissioning, during which baseline signatures should be captured. These baseline captures can be used for comparison with future signatures.
In addition to initial system testing, ICS generally does not change regularly; unless certain changes in the system indicate that ICS devices or programs are changing, the system will operate as it was installed, which may be due to process changes, equipment replacements, program efficiency changes, or other factors, but these are not normal operating conditions. In fact, systems can operate for years without any changes, and apart from static environments, ICS must be consistent in change management. End users cannot accurately document every change, but significant changes to the system are usually documented. Captured device signatures should be part of the change management process, allowing baseline signatures to be updated as needed based on new configurations.
ICS devices should also be tested regularly during inspections and downtime. The testing frequency may be once a year or every few years, but it is usually conducted at fixed intervals. During this period, signatures should also be collected for the system.
3 Testing and Data Analysis of Network Reliability Monitoring
3.1 Comparison of Real-Time Testing and Periodic Testing
In reality, maintaining situational awareness may require real-time analysis of these signatures. Real-time testing requires monitoring sensors to be installed throughout the network, which need to have sufficient capability to capture and analyze network communication flows in real-time and report them to the corresponding monitoring system. To accommodate the increased communication flow to the monitoring system, it may sometimes be necessary to scale the infrastructure, and operators must be responsible for monitoring analysis results as part of their normal management duties. All these factors significantly reduce the impact of real-time monitoring of reliability data on operational operations, and in most cases, applying real-time NRM may not be cost-effective.
A simpler and more effective approach using NRM is to use a small number of temporarily deployed NRM sensors. These NRM sensors can collect and analyze network communication flows at selected points throughout the system at different frequencies based on the criticality of the environment.
At certain times, by using a small number of sensors that can connect to the network and have better performance, it is possible to avoid modifying the network infrastructure. Communication flows can be captured on-site on the desired network infrastructure, so there is no need to pass through firewalls, DMZs, or other network devices to collect data. Additionally, data can be collected at different locations throughout the network and post-processed. Engineers can be responsible for signature comparisons at different times without needing to view signatures in real-time while capturing data.
3.2 Automated Testing and Analysis
While continuous monitoring of the NRM system may not be necessary, it is best to automate the capture and analysis process. In a normal ICS environment, the volume of data collected and the number of communication flows can make manual analysis very difficult and time-consuming; for communication flow captures measured in hours, it may take days to analyze all collected communication flows (depending on the complexity of the analysis). Therefore, when choosing to use NRM, the automation of its processes should be considered first; using tools like Wireshark for visual analysis of communication flows is not practical when reviewing multiple capture files.
Most communication flow analysis can be achieved by writing scripts. Many spreadsheet programs have some form of scripting language that can be used to import files and automatically perform calculations on the imported files. Engineers still need to perform some form of analysis on these script files, but most of the analysis can be completed by computers without human interaction.
3.3 Data Analysis and Communication Flow Statistics
When viewing the graphs shown in Figure 4, it is necessary to know whether the types of beat patterns shown in the graph are in normal operating mode or abnormal operating mode. Since the dataset captured during a short capture time can be very large, it is necessary to convert the data into some form of statistical data to monitor and compare it over time.
The simplest and most common way to view data is through averages, minimums, and maximums; this type of statistical data can be easily obtained from the devices themselves as part of their maintenance characteristics. However, they do not tell the whole story; to better understand what is happening, other statistical and mathematical methods need to be applied.
Another simple statistical metric that needs to be calculated is the standard deviation, which helps in understanding communication flows. If communication flows are normally tightly distributed but begin to widen over time, it indicates that there may be a problem. The root cause of the problem may be difficult to determine, but investigating the root cause may reveal new factors affecting performance.
Additionally, standard deviation can also serve as an IOC. Periodic jitter analysis of a “man-in-the-middle” (MITM) attack on the test system is shown in Figure 5. In this case, the average MPI remains unchanged (about 10 ms), but the distribution shows significant changes, with side lobes appearing at about 8 ms and 12 ms. Such situations can be easily detected during standard deviation analysis.
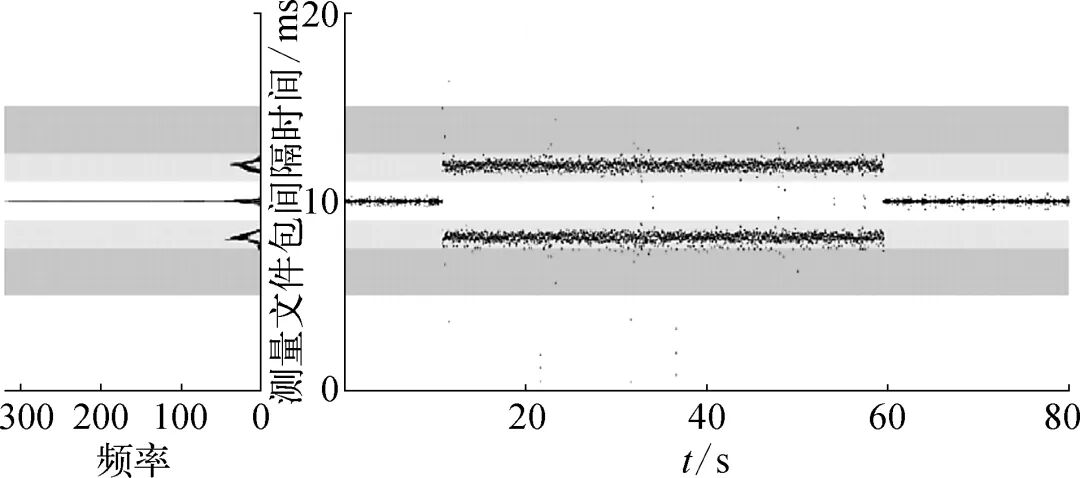
Figure 5 Example of Periodic Jitter Analysis Indicating MITM Attack
Other types of analysis can also provide more information, such as Fast Fourier Transform, convolution, and correlation functions, which can be used to better understand communication flows. Given that these algorithms can run quickly under moderate hardware conditions, they should be considered. They do require some time for computation, so they may not be suitable for initial data analysis, but they are more suitable for deeper secondary or tertiary data analysis.
As a balanced and quick statistical dataset that can provide preliminary insights into the various communication flows contained in some basic datasets, a basic set of metrics that can be used includes: average, minimum, maximum, and standard deviation.
For a normal ICS network, these four statistics can be calculated in a very short time (almost real-time). Communication flows can be captured at a certain frequency, usually in cycles of 30 seconds or 60 seconds, and the statistics for these communication flows can be calculated before obtaining the next communication flow capture file. Thus, basic data analysis can be conducted under near-real-time conditions, and if more in-depth analysis is needed, the mathematical and statistical methods mentioned above can be used to reanalyze the communication flow captures.
Calculating statistics is not only convenient and quick but also easy for engineers and operators to understand. The above metrics can display trend changes on dashboards, and over time, it is easy to compare. If data significantly exceeds the range, it indicates that a problem has occurred that needs investigation. In many cases, simply knowing that conditions are changing is enough to alert operators to potential issues in the ICS environment. Not all indicators will lead to significant alarms, but they may indicate that some maintenance activities should be conducted to return the system to its expected state. These statistics provide a good set of information that allows engineers to understand the data without being overwhelmed by excessive information.
4 Conclusion
NSM is a good approach for many systems, but it is not designed for the lower networks of ICS environments. Many existing simple tools can be used for some form of NRM across various layers of the ICS environment. However, the tools and techniques discussed in this article are more suitable for the lower structure of the network, where continuous monitoring of NRM is not necessary. In fact, adapting to continuous NRM may require significant changes to the network structure, so periodic, localized testing may be a better approach.
Automation of testing and data analysis is very important for NRM, as the time required to analyze the number of communication flows increases exponentially as networks grow larger. The tools and algorithms required for analyzing communication flows do not need to be overly complex to gain a basic understanding of the ICS environment; when anomalies are detected, more complex analyses can be conducted as needed, but they are typically not required during normal operations.
Author Biography
XU Zhijie (1974—), male, from Tianjin, graduated in 2018 from China University of Petroleum (East China) with a master’s degree in Chemical Engineering Safety, currently employed at Kenexis Consulting, mainly engaged in safety instrumented system assessments, fire gas system effectiveness assessments, and process safety management system creation, serving as the company’s Technical Director for the Asia-Pacific region and a Senior Engineer.

Editor: ZHANG Lin
Follow Us:
1. Scan the QR code

2. Search for the WeChat public account “Self-Control Center Station” and click to follow