Exploratory Data Analysis (EDA) is a crucial part of data science model development and dataset research. When acquiring a new dataset, a significant amount of time is initially spent on EDA to explore the inherent information within the dataset. Automated EDA Python packages can perform EDA with just a few lines of Python code.
This article compiles 10 Python packages that can automatically execute EDA and generate insights about the data. Let’s see what features they offer and to what extent they can help us automate the EDA process.
- DTale
- Pandas-profiling
- sweetviz
- autoviz
- dataprep
- KLib
- dabl
- speedML
- datatile
- edaviz
1. D-Tale
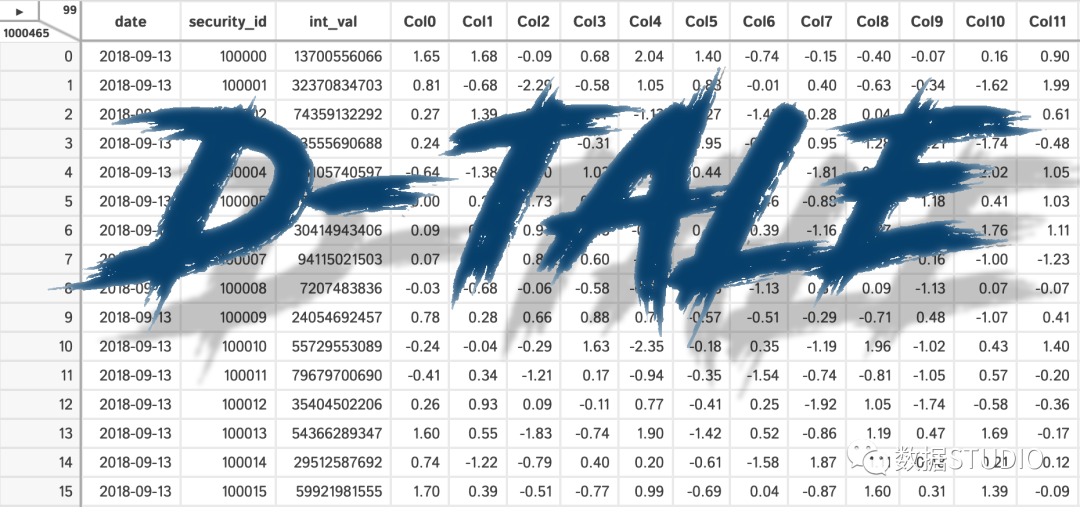
D-Tale uses Flask as the backend and React for the frontend, seamlessly integrating with IPython notebooks and terminals. D-Tale supports Pandas DataFrames, Series, MultiIndex, DatetimeIndex, and RangeIndex.import dtaleimport pandas as pddtale.show(pd.read_csv(“titanic.csv”))
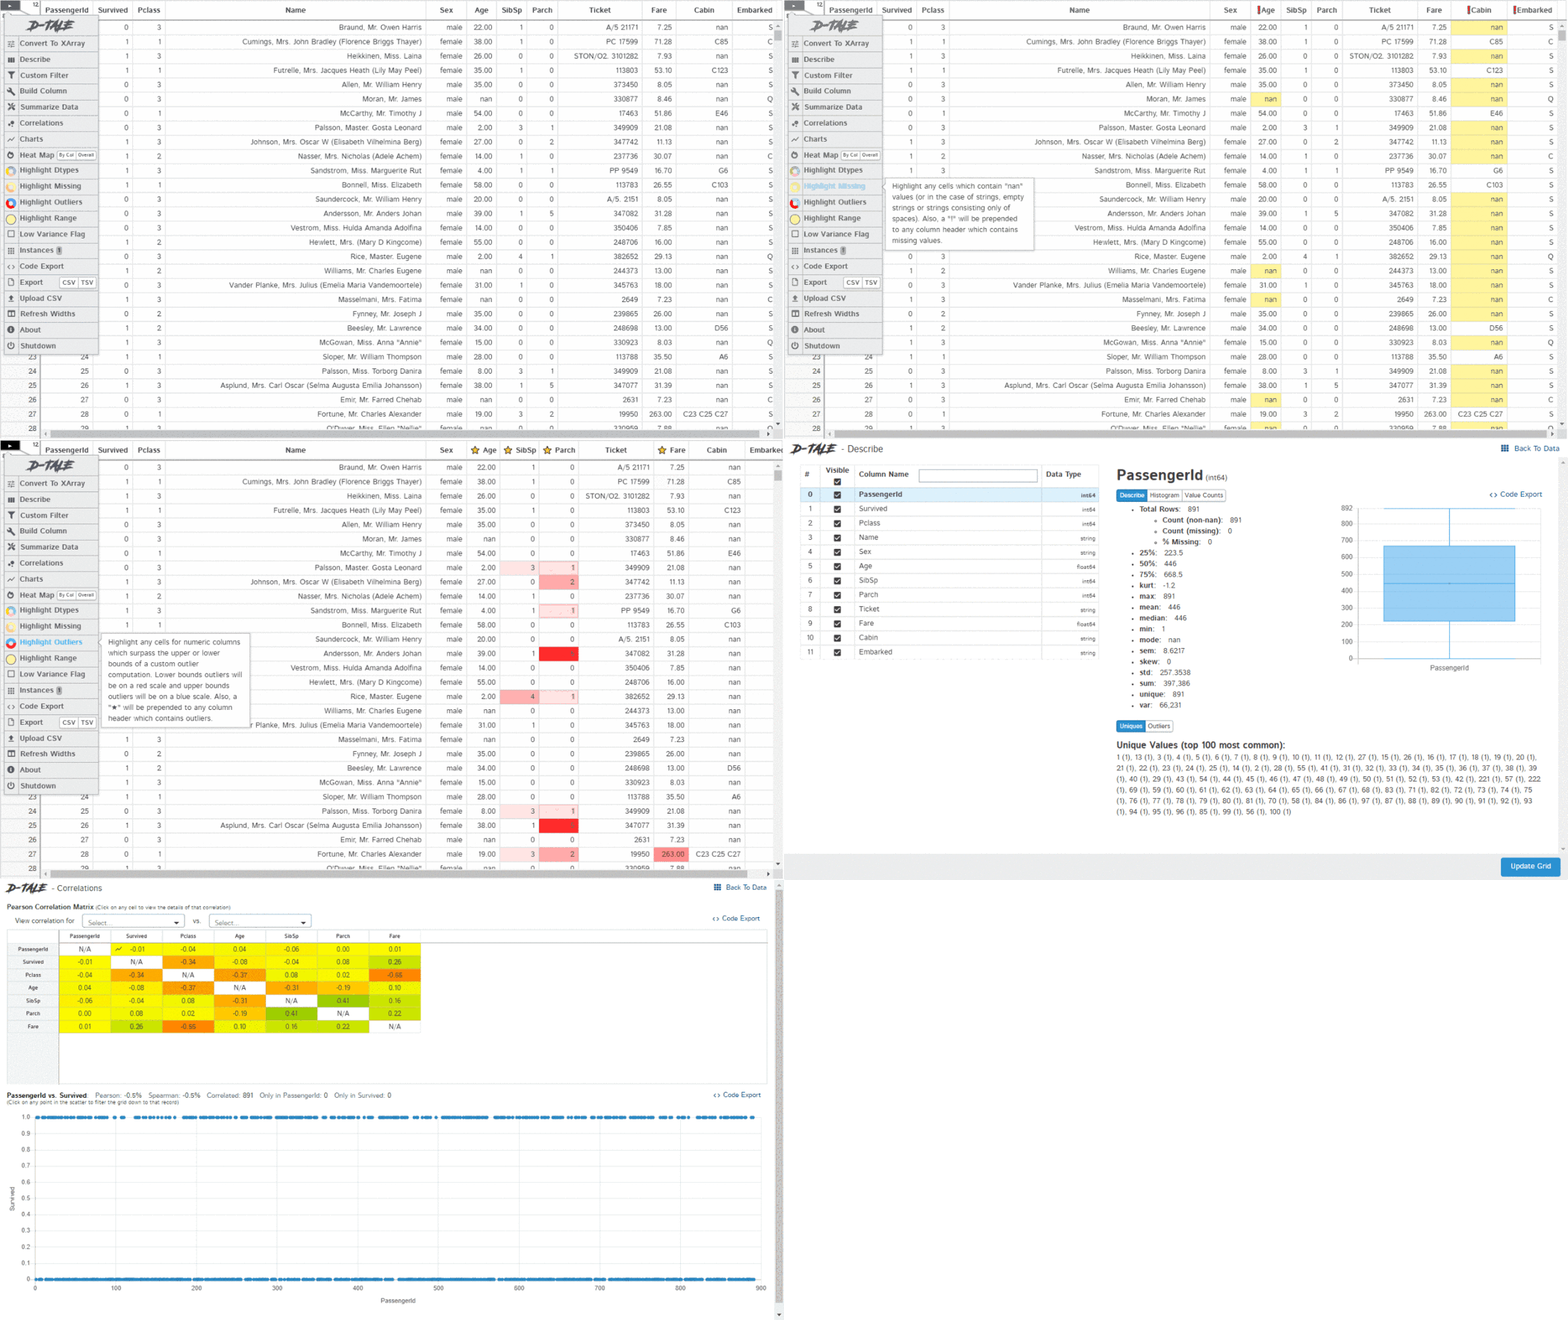
The D-Tale library can generate a report with a single line of code, summarizing the dataset, correlations, charts, and heatmaps, highlighting missing values, etc. D-Tale also allows for analysis of each chart in the report, as seen in the screenshot where the charts are interactive.2. Pandas-Profiling

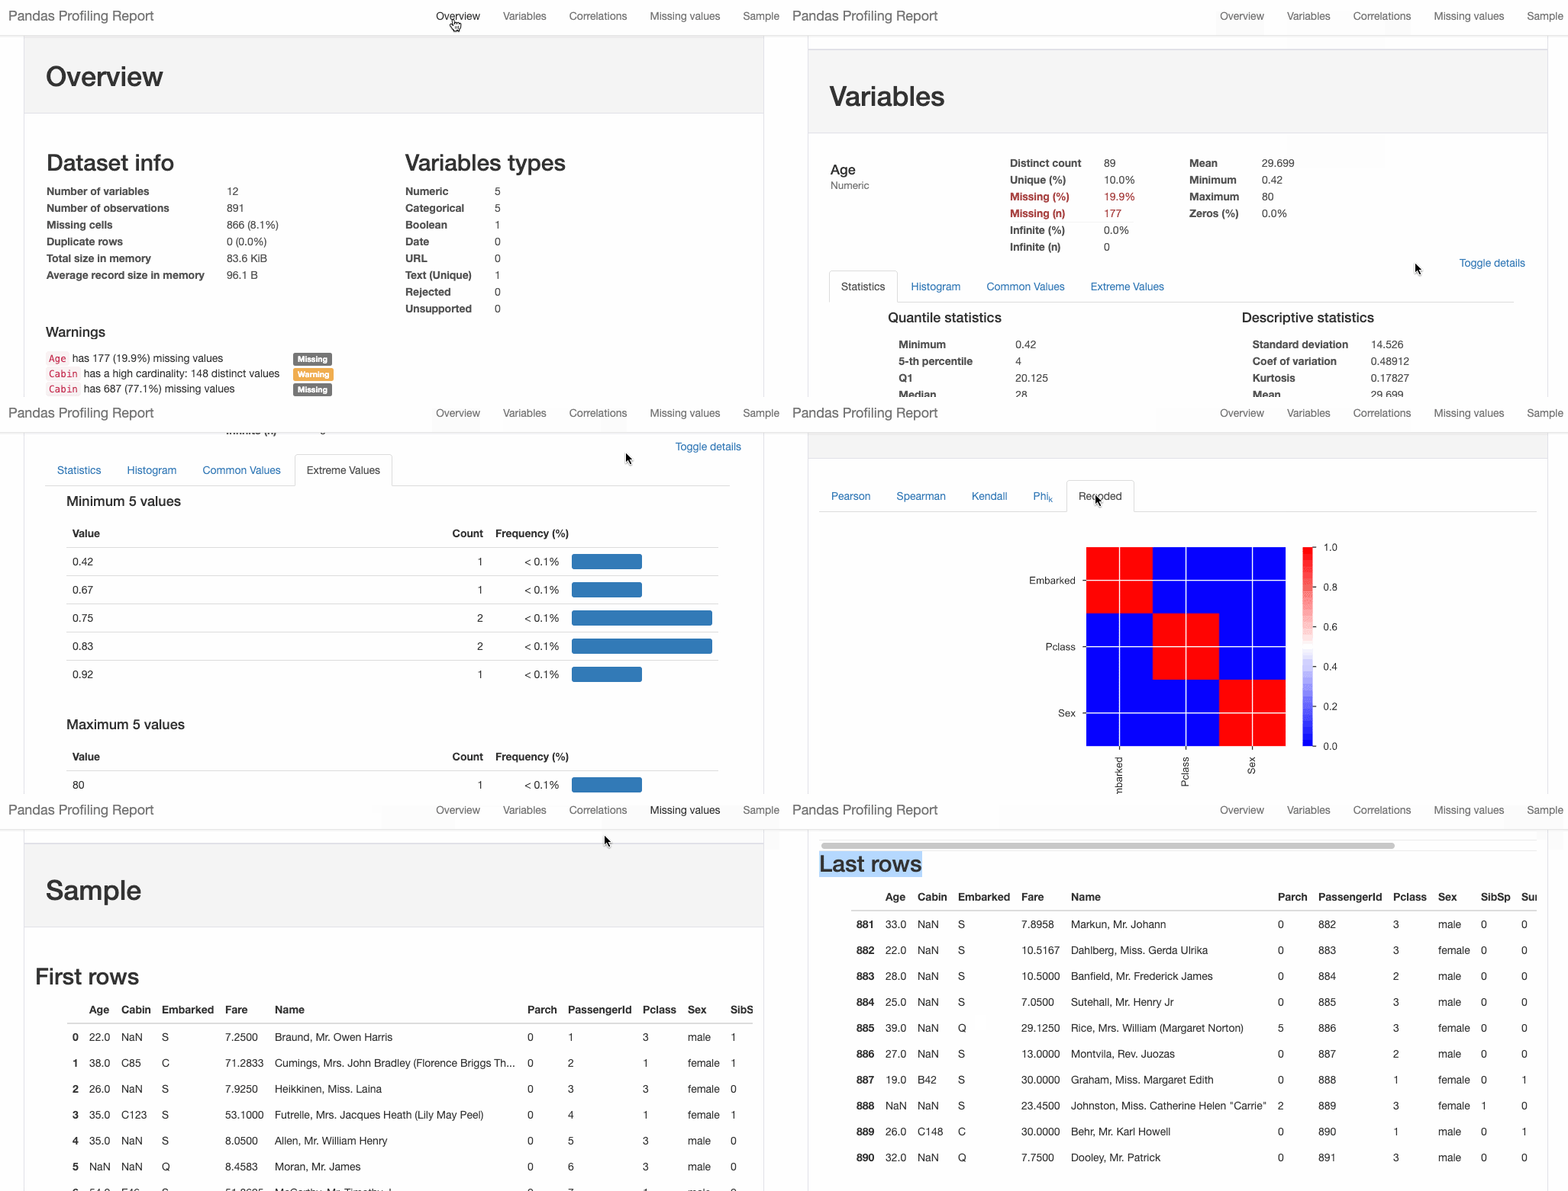
Pandas-Profiling can generate a summary report of a Pandas DataFrame. The panda-profiling extends the pandas DataFrame df.profile_report() and works very well on large datasets, creating reports in seconds.#Install the below libraries before importingimport pandas as pdfrom pandas_profiling import ProfileReport#EDA using pandas-profilingprofile = ProfileReport(pd.read_csv(‘titanic.csv’), explorative=True)#Saving results to an HTML fileprofile.to_file(“output.html”)
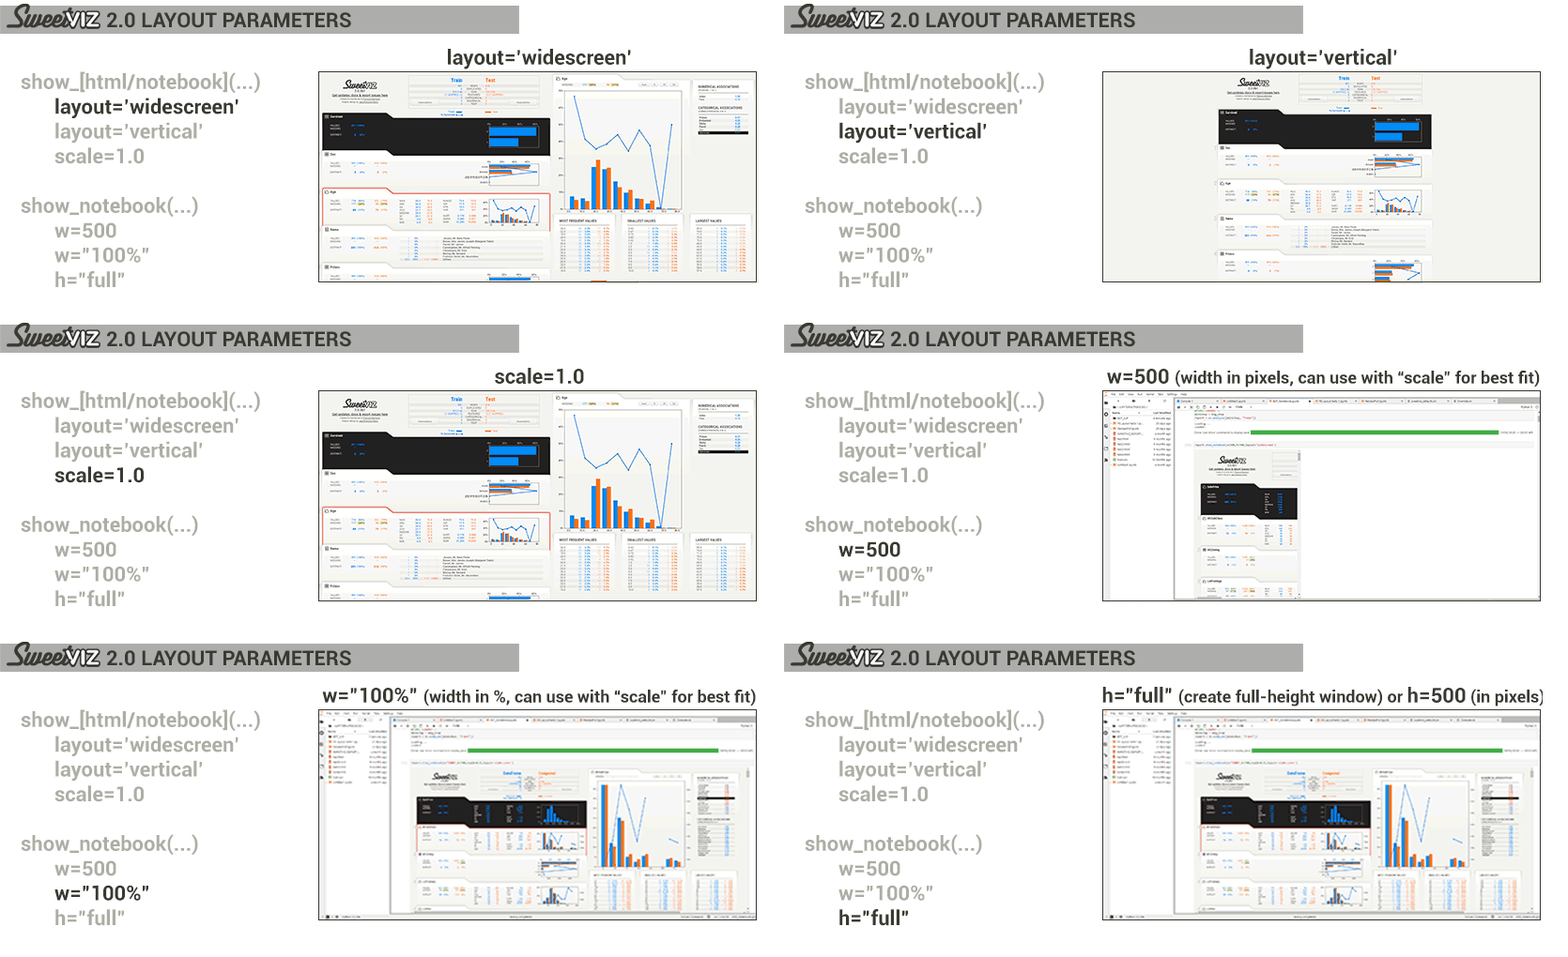
3. Sweetviz Sweetviz is an open-source Python library that can generate beautiful visualizations with just two lines of Python code, launching EDA (Exploratory Data Analysis) as an HTML application. The Sweetviz package is built around quickly visualizing target values and comparing datasets.import pandas as pdimport sweetviz as sv#EDA using Sweetvizsweet_report = sv.analyze(pd.read_csv(“titanic.csv”))#Saving results to HTML filesweet_report.show_html(‘sweet_report.html’)The report generated by the Sweetviz library includes a summary of the dataset, correlations, and associations between categorical and numerical features.
4. AutoViz
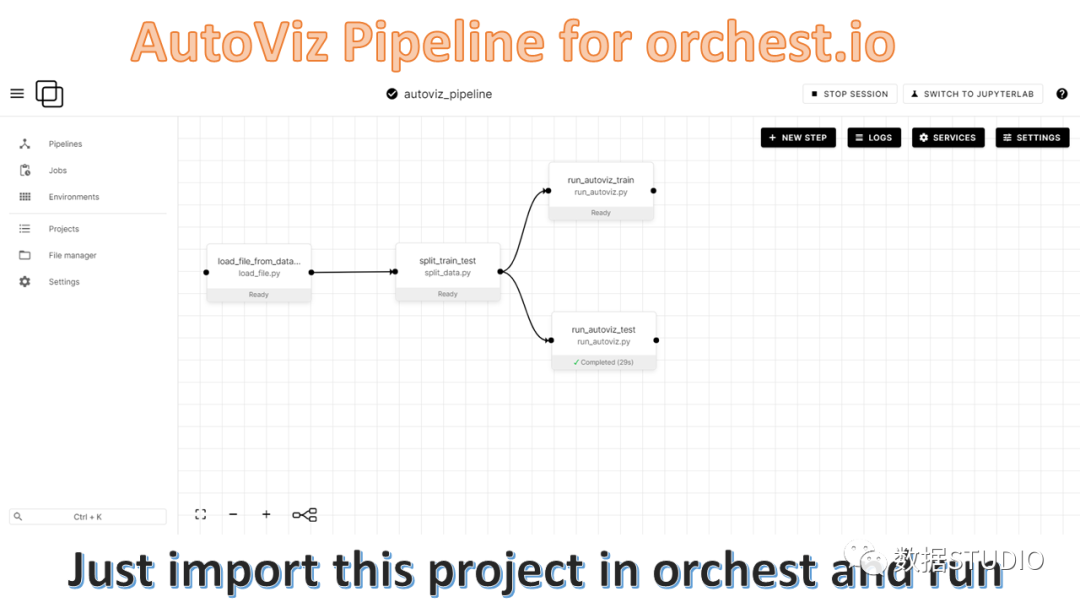
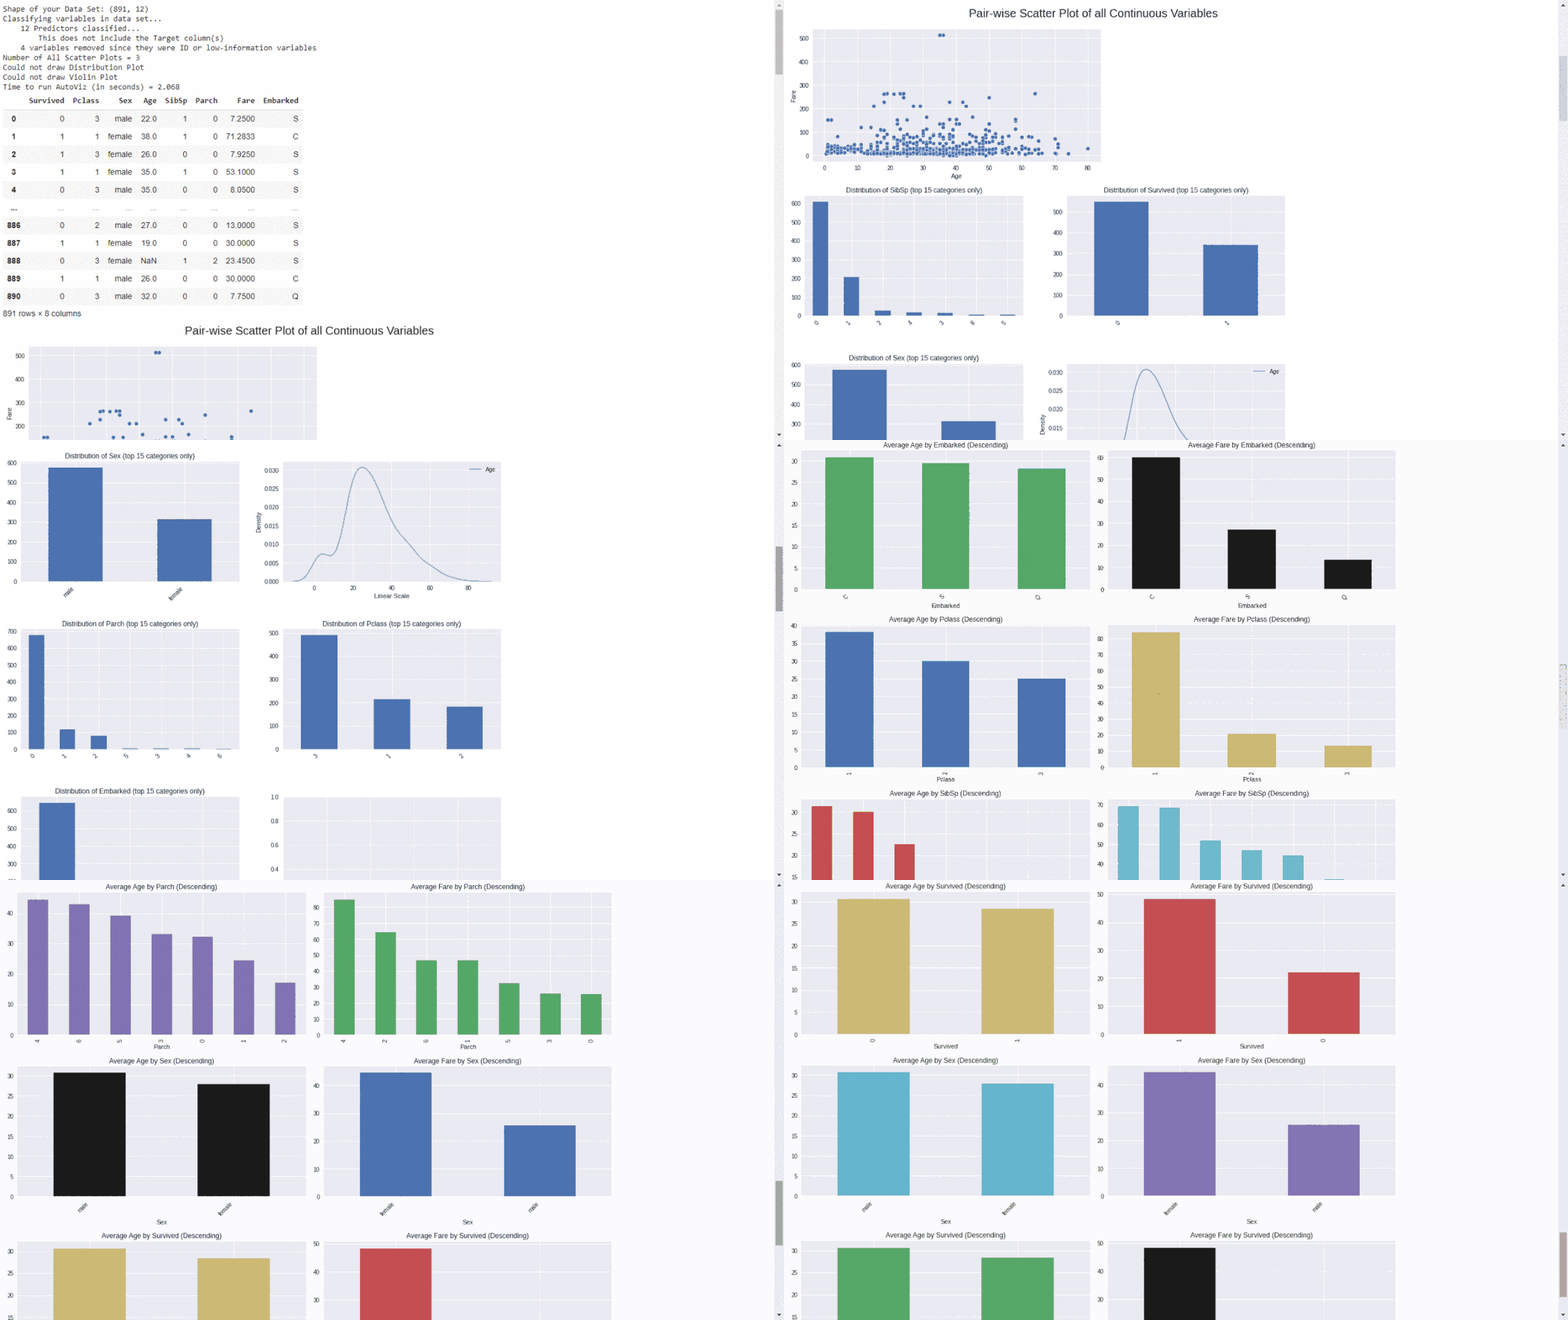
The AutoViz package can automatically visualize datasets of any size with a single line of code and generate HTML, Bokeh, and other reports. Users can interact with the HTML reports generated by the AutoViz package.import pandas as pdfrom autoviz.AutoViz_Class import AutoViz_Class#EDA using AutoVizautoviz = AutoViz_Class().AutoViz(‘train.csv’)
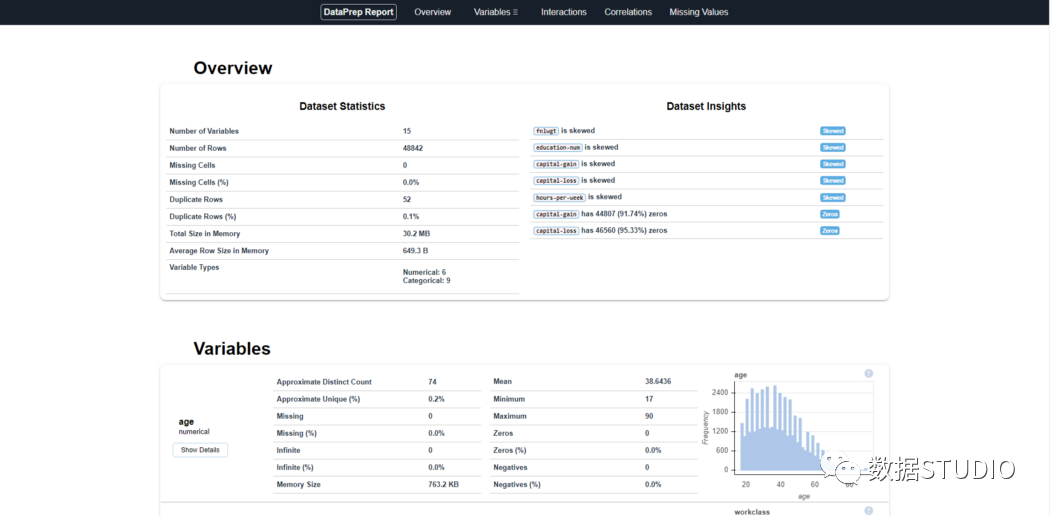
5. Dataprep Dataprep is an open-source Python package for analyzing, preparing, and processing data. DataPrep is built on top of Pandas and Dask DataFrames, making it easy to integrate with other Python libraries.Dataprep is the fastest among these 10 packages, generating reports for Pandas/Dask DataFrames in seconds.from dataprep.datasets import load_datasetfrom dataprep.eda import create_reportdf = load_dataset(“titanic.csv”)create_report(df).show_browser()
6. Klib
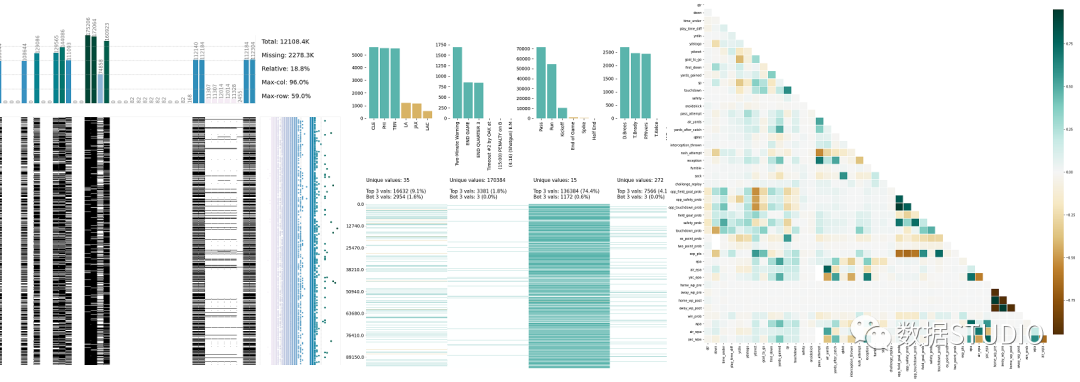
Klib is a Python library for importing, cleaning, analyzing, and preprocessing data.import klibimport pandas as pddf = pd.read_csv(‘DATASET.csv’)klib.missingval_plot(df)
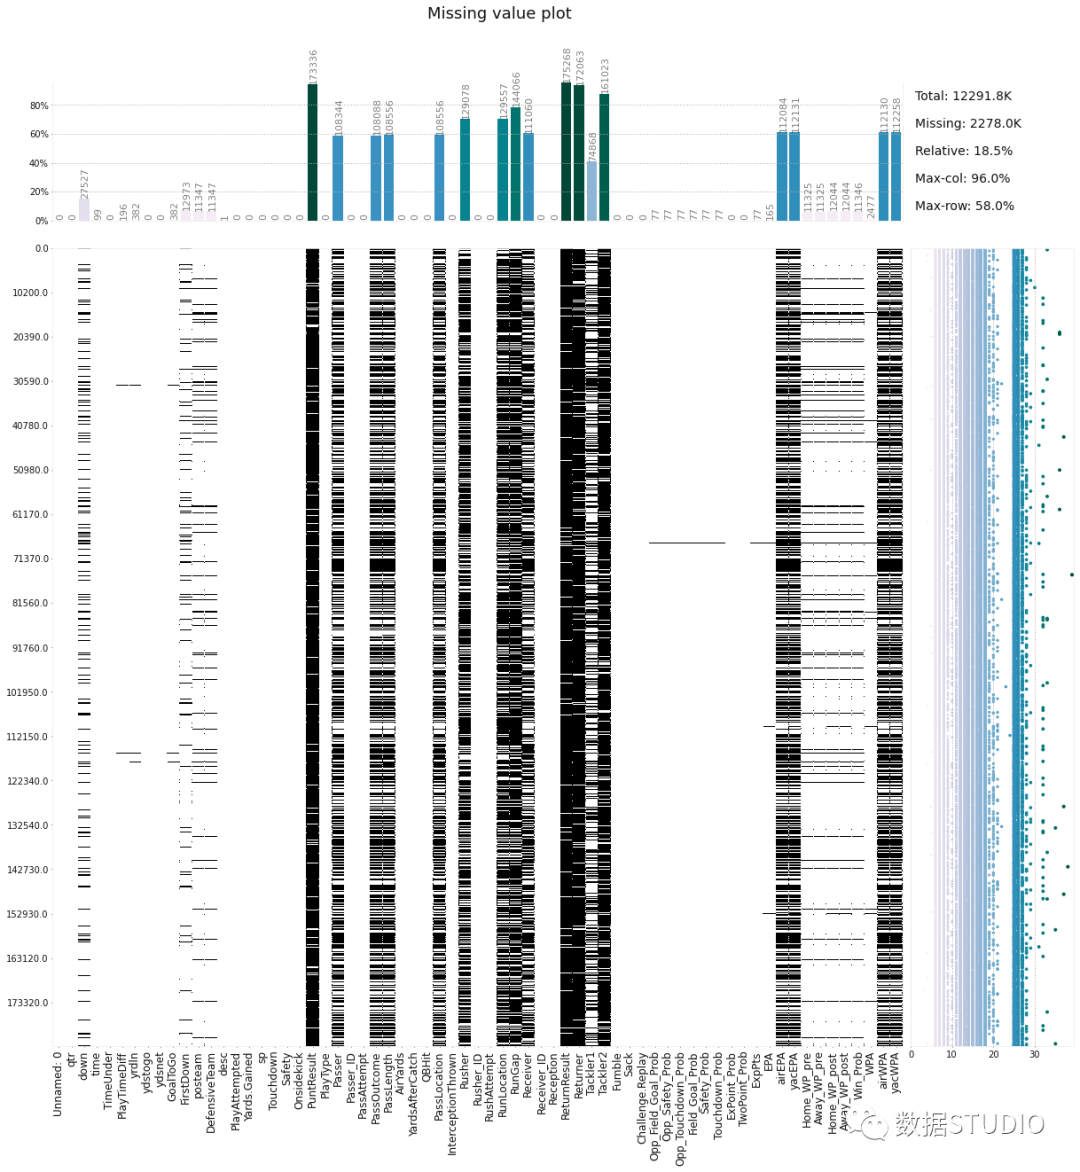
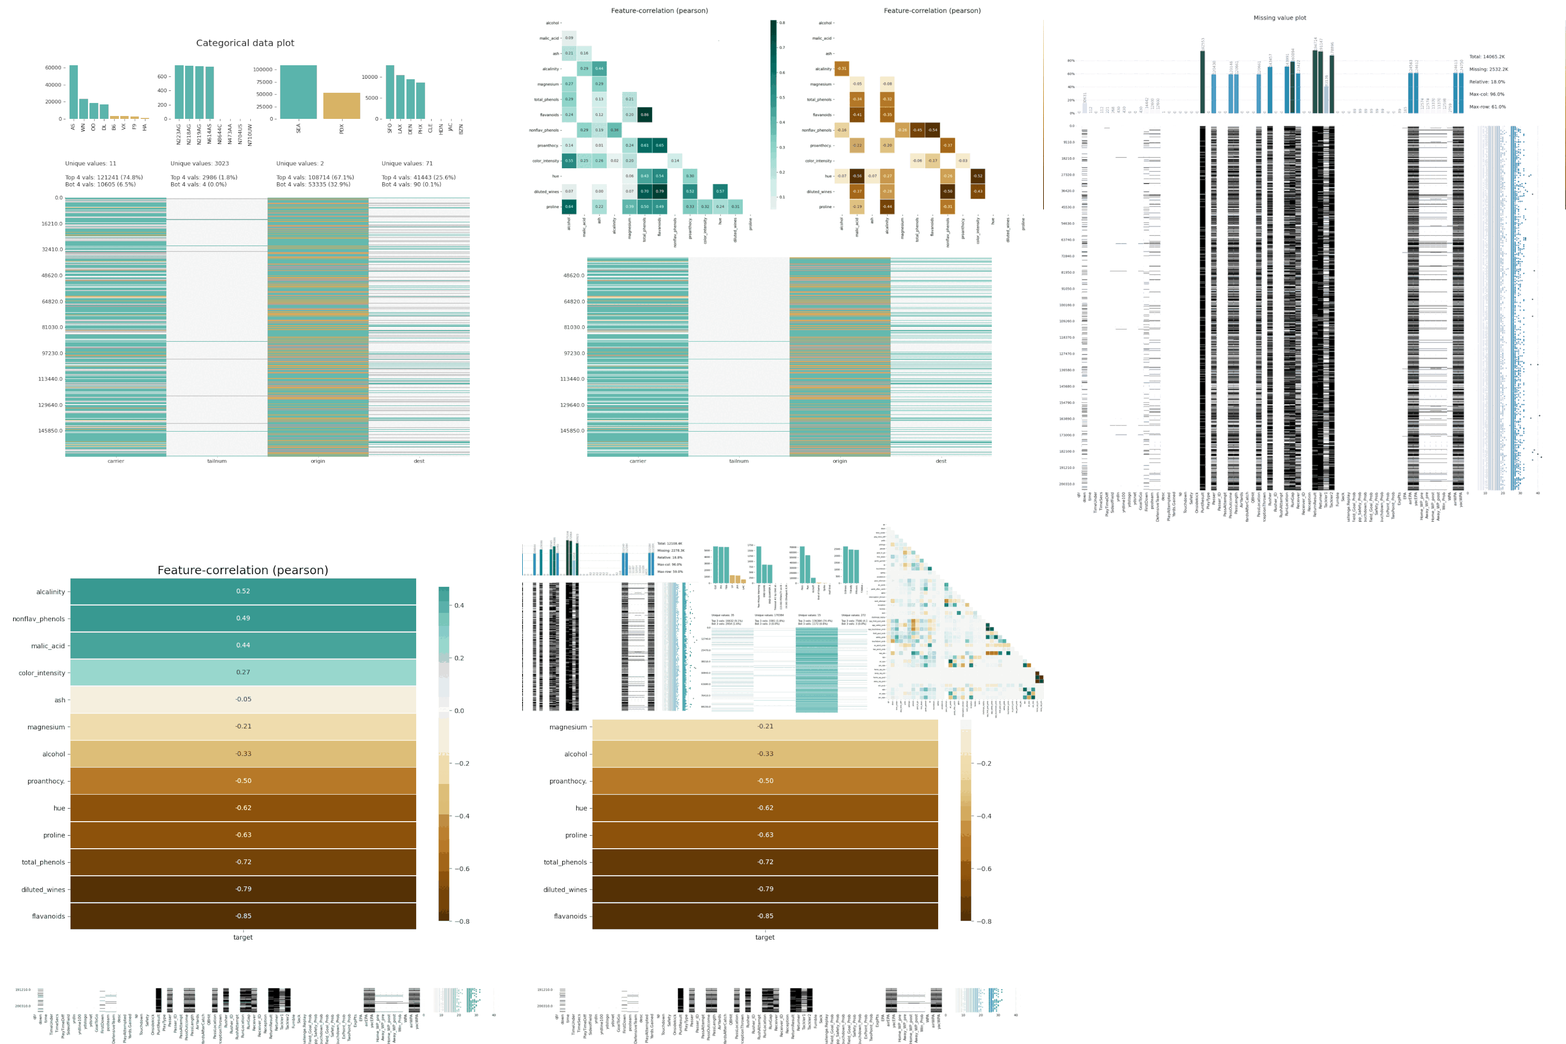
klib.corr_plot(df_cleaned, annot=False) klib.dist_plot(df_cleaned[‘Win_Prob’])
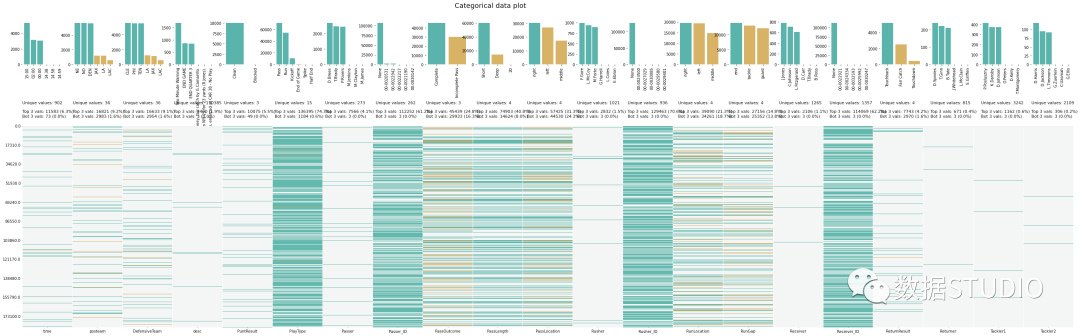
klib.cat_plot(df, figsize=(50,15))
Although Klib provides many analysis functions, it requires us to manually write code for each analysis, making it a semi-automated operation. However, it is very convenient for more customized analyses.
7. Dabl
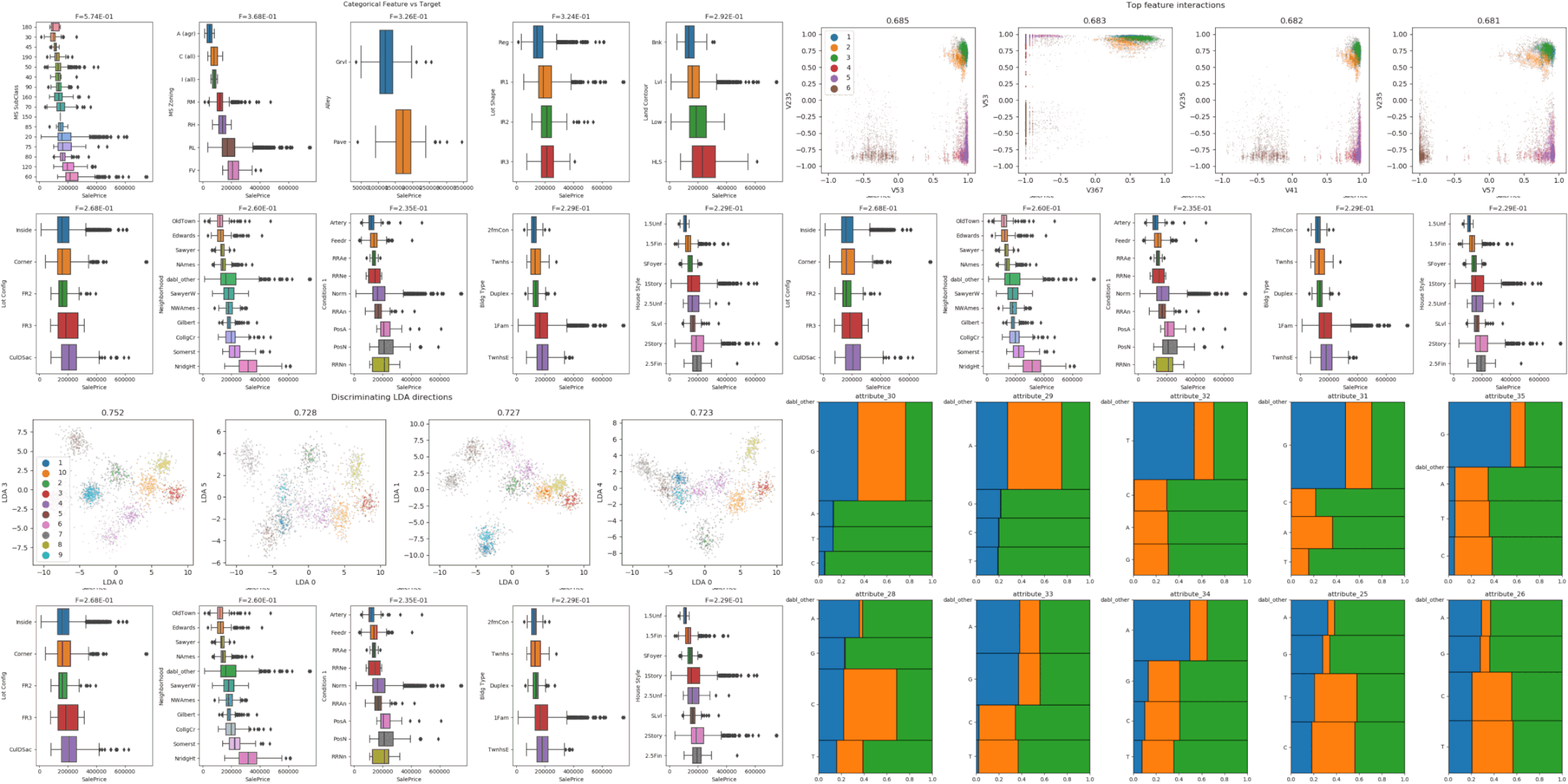
Dabl focuses less on individual column statistics and more on providing a quick overview through visualization, as well as convenient machine learning preprocessing and model searching.
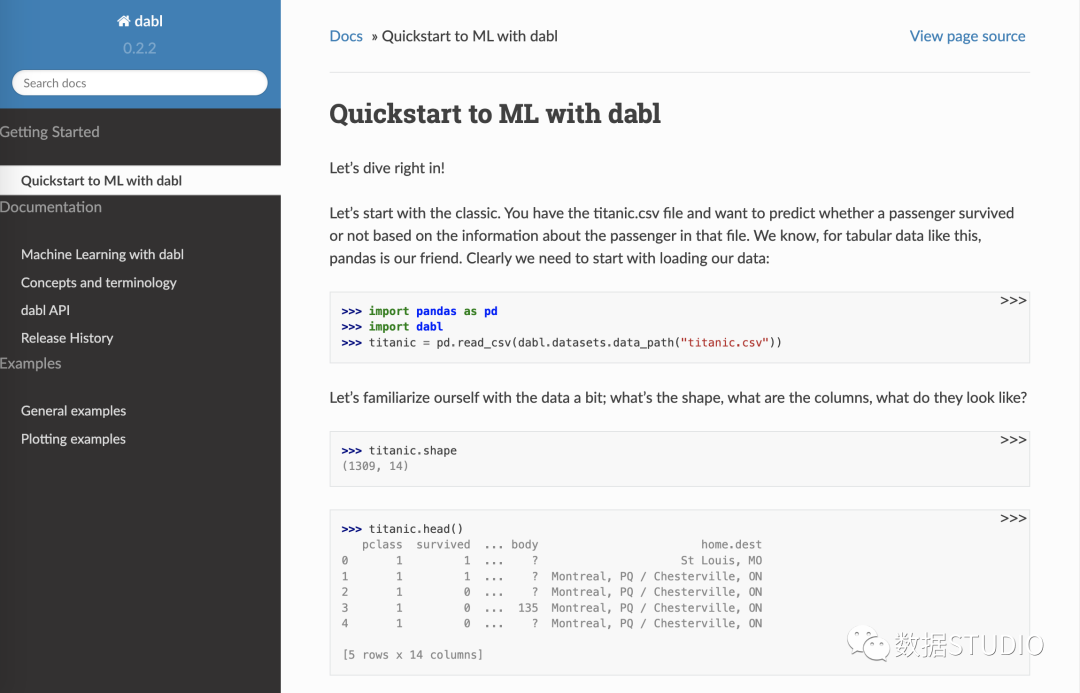
The Plot() function in dabl can achieve visualization by plotting various graphs, including:
- Target distribution plots
- Scatter plots
- Linear Discriminant Analysis
import pandas as pdimport dabldf = pd.read_csv(“titanic.csv”)dabl.plot(df, target_col=“Survived”)
8. SpeedML
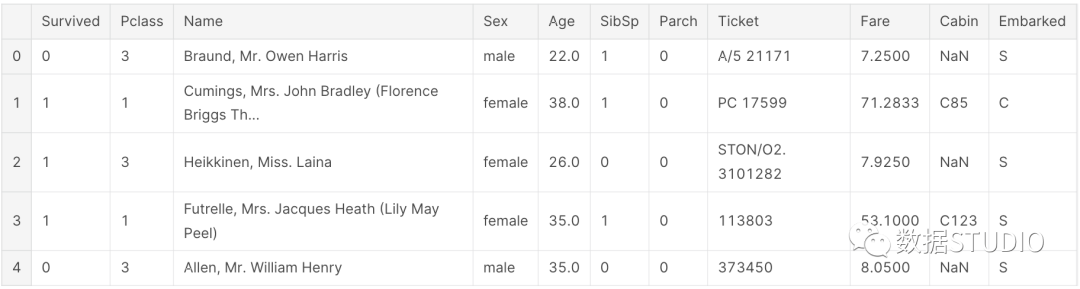
SpeedML is a Python package for quickly launching machine learning pipelines. SpeedML integrates several commonly used ML packages, including Pandas, Numpy, Sklearn, Xgboost, and Matplotlib, so it actually offers more than just automated EDA functionality.According to SpeedML, using it can reduce coding time by 70% based on iterative development.from speedml import Speedmlsml = Speedml(‘../input/train.csv’, ‘../input/test.csv’, target = ‘Survived’, uid = ‘PassengerId’)sml.train.head()
sml.plot.correlate()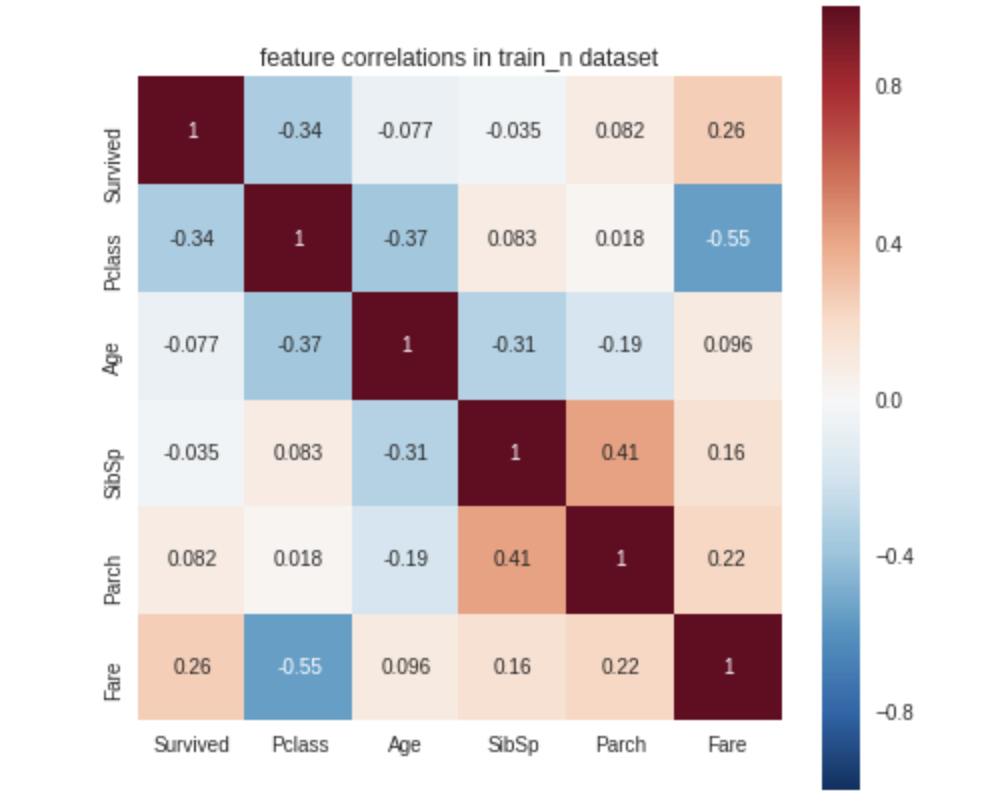 sml.plot.distribute()
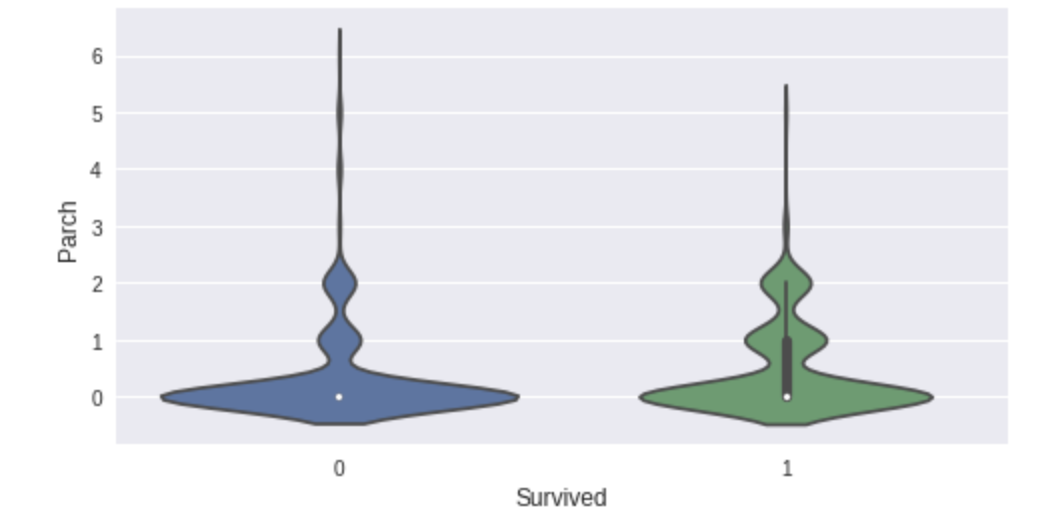
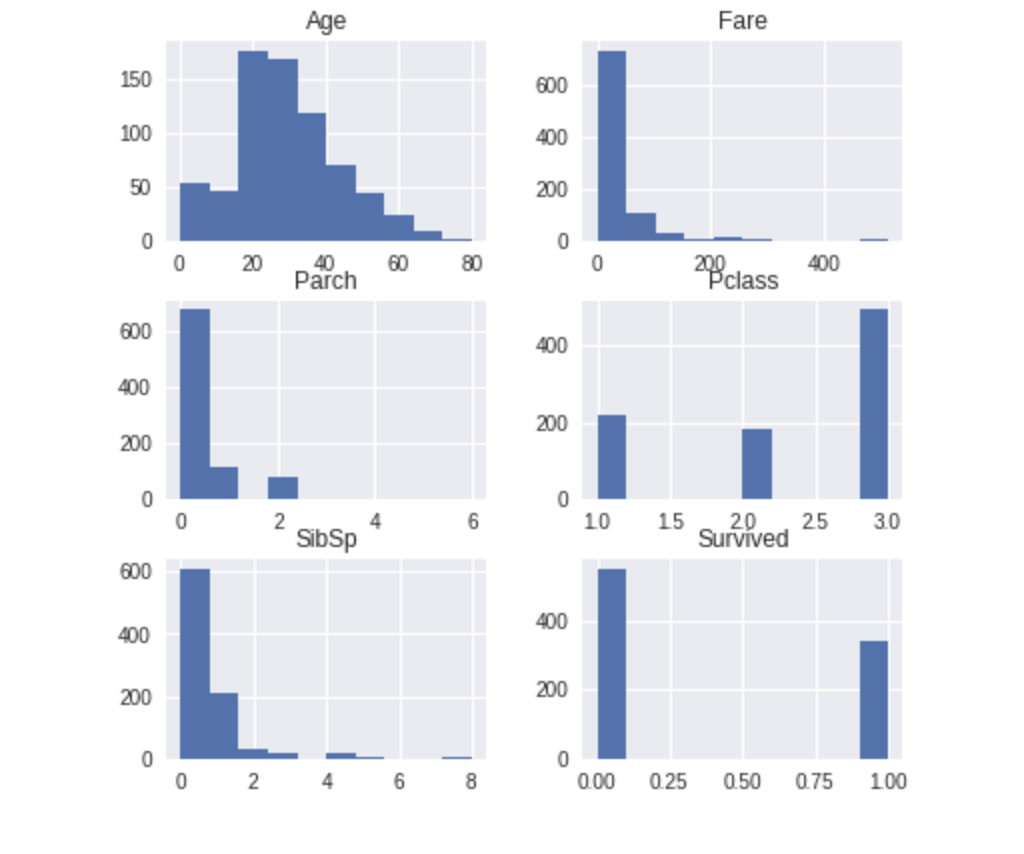 sml.plot.ordinal(‘Parch’)
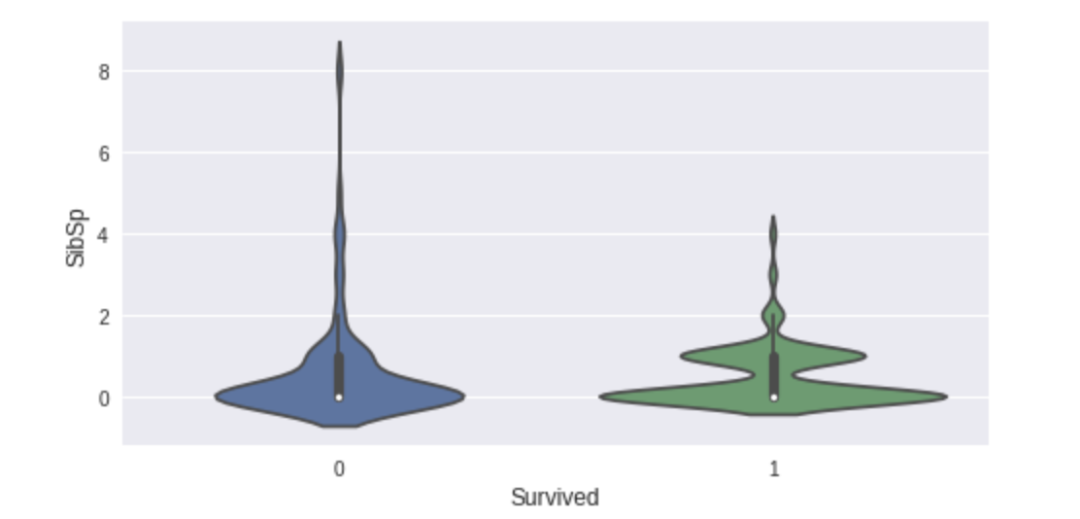
 sml.plot.ordinal(‘SibSp’)
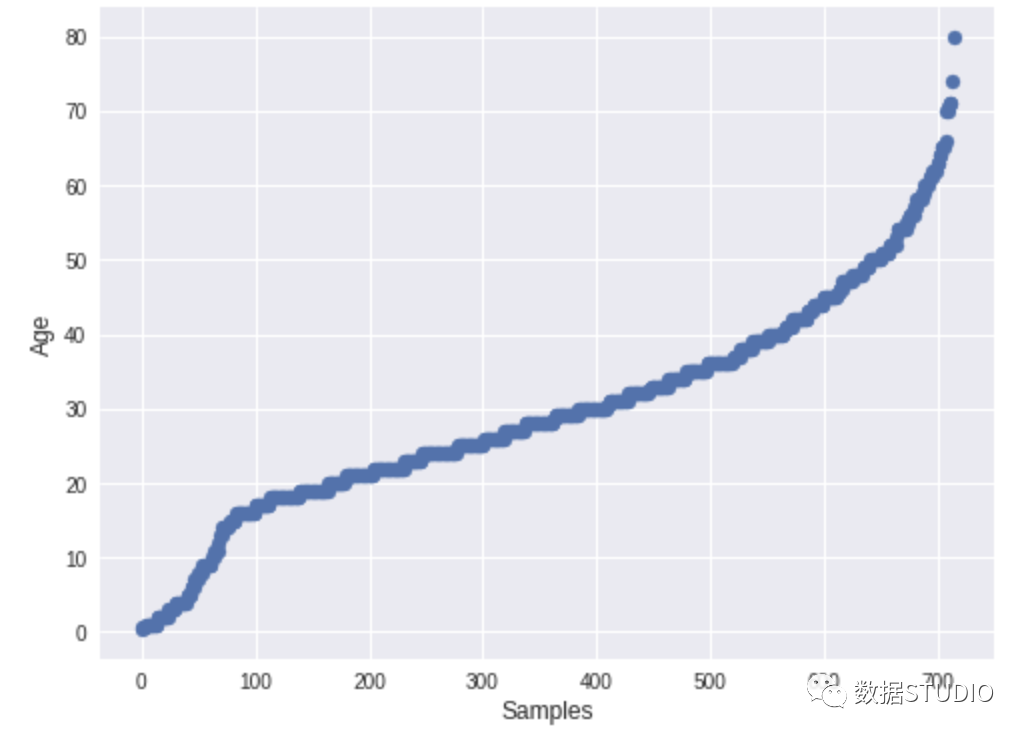
 sml.plot.continuous(‘Age’)
9. DataTile
DataTile (formerly known as Pandas-Summary) is an open-source Python package responsible for managing, summarizing, and visualizing data. DataTile is essentially an extension of the PANDAS DataFrame describe() function.import pandas as pdfrom datatile.summary.df import DataFrameSummarydf = pd.read_csv(‘titanic.csv’)dfs = DataFrameSummary(df)dfs.summary()
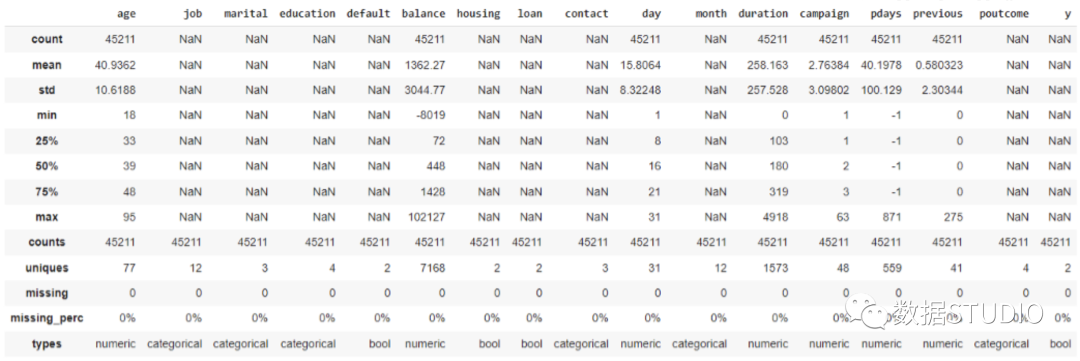
10. edaviz
edaviz is a Python library that allows for data exploration and visualization in Jupyter Notebook and Jupyter Lab. It was very user-friendly, but later acquired by Databricks and integrated into bamboolib, so here we will just provide a brief demonstration.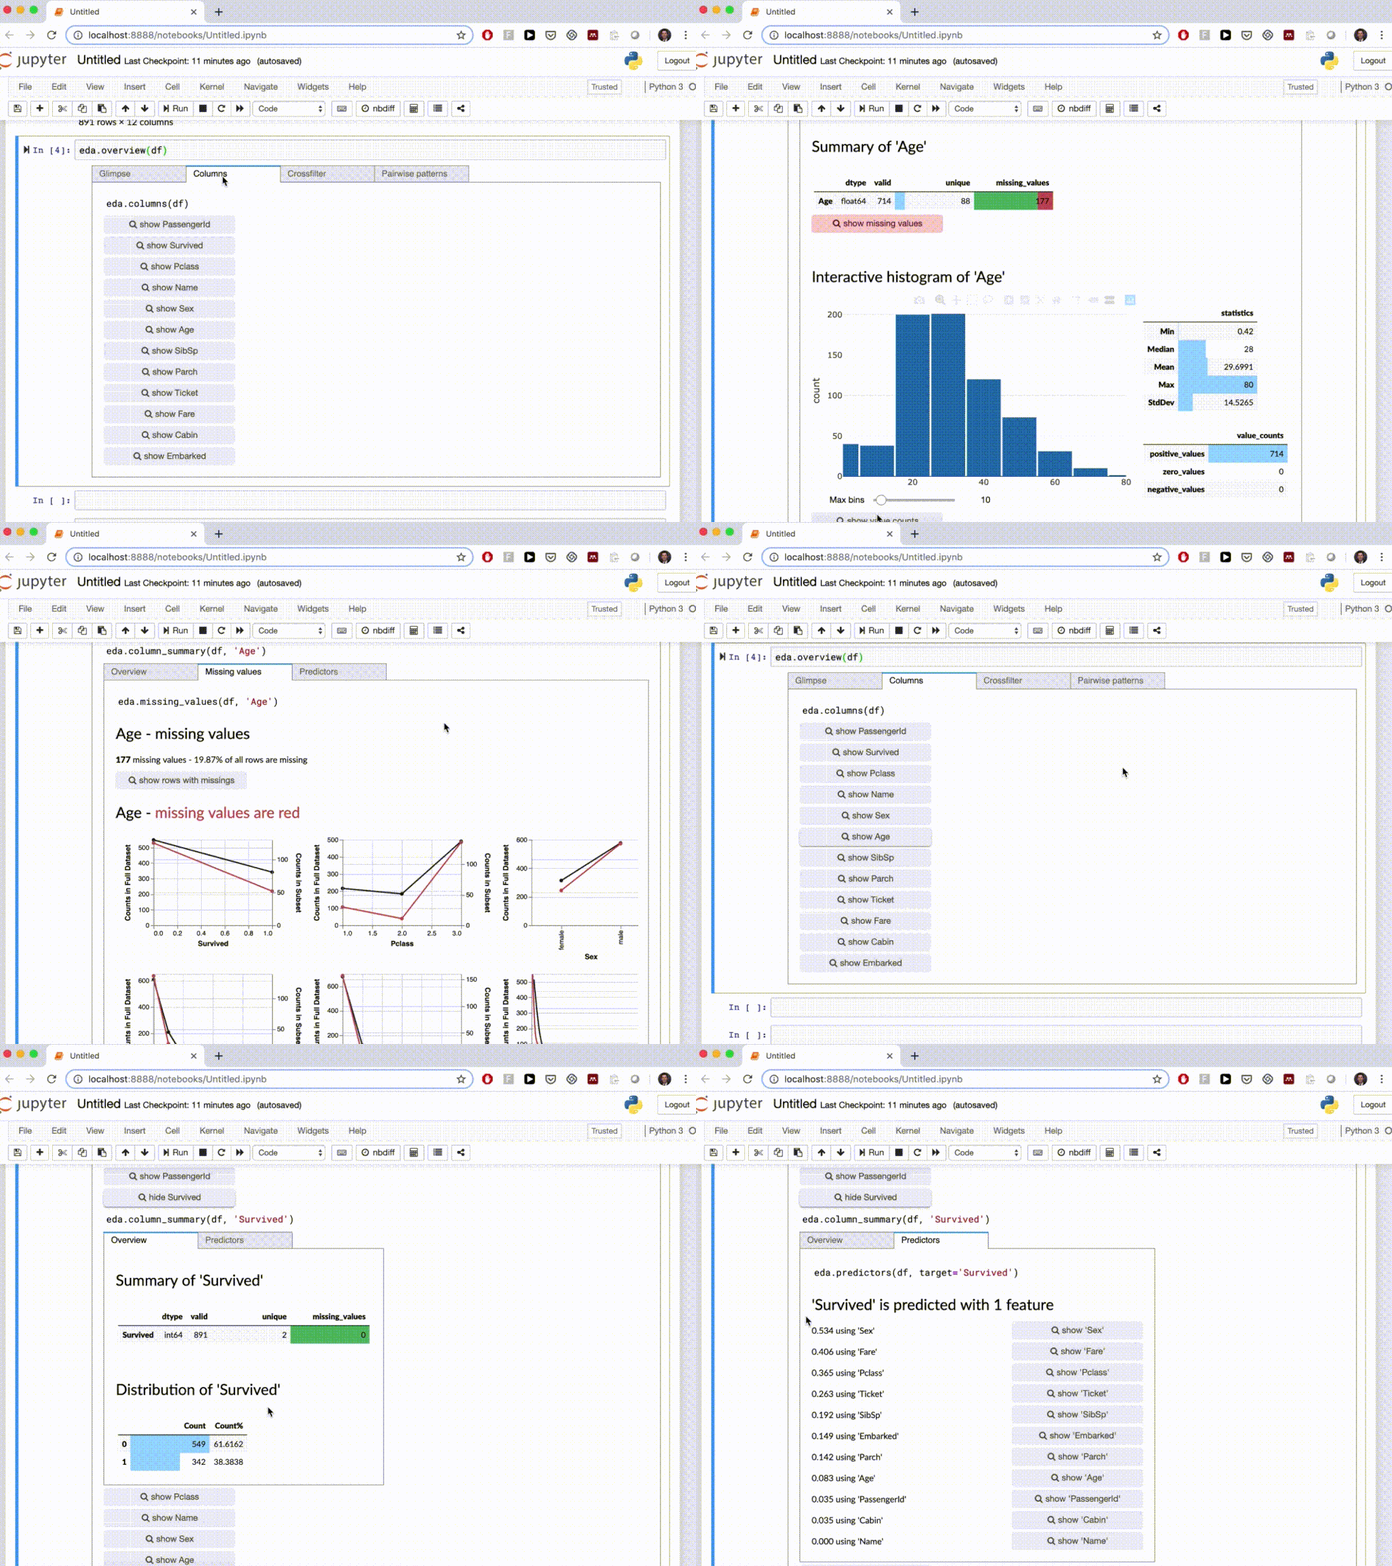 ConclusionIn this article, we introduced 10 Python packages for automated exploratory data analysis that can generate data summaries and visualizations in just a few lines of Python code. The automation can save us a lot of time.Dataprep is my most frequently used EDA package, and AutoViz and D-table are also good choices. If you need customized analysis, Klib is very convenient. SpeedML integrates many features, but using it solely for EDA analysis is not particularly suitable. The other packages can be chosen based on personal preference, as they are all quite useful. Lastly, edaviz should not be considered since it is no longer open source.