Matlab Quick Exercise 4.3.1: Surface Plot Based on Data
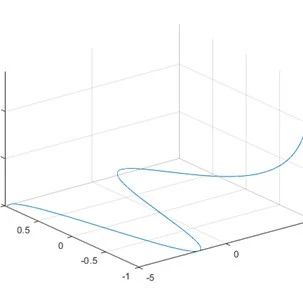
Last issue’s answer: 4.2.3 Parametric Function Plotting Matlab Quick Exercise 4.2.3 Parametric Function Plotting [Reference Video31.17] The program is as follows: xt=@(t)t; yt=@(t)sin(t); zt=@(t)exp(t); fplot3(xt,yt,zt) Running result: ——————— Non-glamorous dividing line —————————4.3 Three-Dimensional Surface Plot 4.3.1Surface Plot Based on Data Plotting the image:f(x,y)= x^2+y^2,-5≤x≤5,1≤y≤11 (The answer will be announced in the next issue)Recommended popular content … Read more