One


Background
After reading the article “Dynamic Tracing Technology Discussion” (https://blog.openresty.com.cn/cn/dynamic-tracing/), I thought about using SystemTap to trace my own developed kernel module.
However, the official documentation of SystemTap (https://sourceware.org/systemtap/documentation.html) only gives examples of tracing kernel modules by using drivers from the kernel source tree, for example: probe module(“ext3”).function(“*”) { }, and indeed, the verification went smoothly (My system uses the xfs file driver, and after executing the stap command, I could see that calling any file using vi would trigger the xfs_iread() function, listing the parameter information):

Then, I wrote the simplest driver, test.c:
#include <linux/module.h>


void test(int n)
{
    printk("%s(), %d: %d\n", __FUNCTION__, __LINE__, n);
}

static int __init test_init(void)
{
    test(100);
    printk("%s(), %d\n", __FUNCTION__, __LINE__);
    return 0;
}

static void __exit test_exit(void)
{
    test(100);
    printk("%s(), %d\n", __FUNCTION__, __LINE__);
}


module_init(test_init);
module_exit(test_exit);

MODULE_LICENSE("GPL");
Makefile:
ifneq ($(KERNELRELEASE),)
	obj-m := test.o
else
	KERNELDIR ?= /lib/modules/$(shell uname -r)/build
	PWD := $(shell pwd)

default:
	$(MAKE) -C $(KERNELDIR) M=$(PWD) modules
clean:
	$(MAKE) -C $(KERNELDIR) M=$(PWD) clean
endif
And x.stap:
#!/usr/bin/env stap


probe begin {
  printf("begin\n");
}

probe module("test").function("*").call {
  printf("%s -> %s\n", thread_indent(1), probefunc())
}

probe module("test").function("*").return {
  printf("%s <- %s\n", thread_indent(-1), probefunc())
}
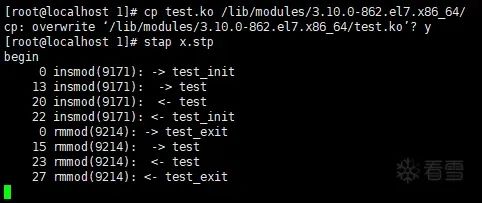
Next, compile test.c -> load test.ko -> execute x.stap (At this moment, I was still trapped in a mindset thinking that loading the driver was a prerequisite for stap to trace that driver):
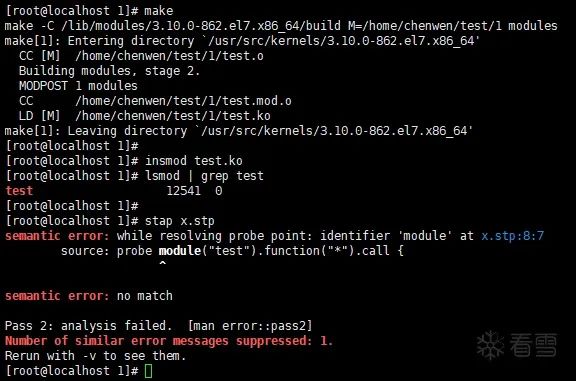
Two


Solving the "stap x.stp" Execution Failure
I initially thought that since the driver was already loaded, and stap still did not recognize it, the problem must be with the compilation of test.ko, so I went around in circles trying to solve this issue.
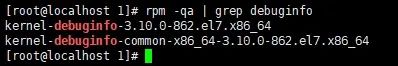
First, I searched on Baidu and Google, and the first few pages of answers all mentioned that I needed to install kernel debuginfo, but my system had already installed it previously, and since I was tracing my own developed driver, it shouldn’t depend on debuginfo in theory.
Then I asked in some WeChat groups, but to no avail; perhaps the experts were too busy to respond to me.
In the end, I had to go back to the official documentation, starting various speculations and attempts.
I remembered that I had previously seen the principle of a dynamic tracing tool, which mentioned that when compiling the traced program, gcc must add the -pg compilation option. This would make gcc add five nop instructions at each function entry, reserving five bytes, which could be replaced with the machine code of “call mcount” during dynamic tracing, allowing the injected code to execute at the tracing point. With this in mind, I added a line in the Makefile:
ccflags-y += -pg
However, the problem still persisted. Looking back at the data, I learned that ftrace relies on the -pg compilation option, while systemtap relies on kprobe, which can trace instructions at any address. Its principle is to replace the first byte of the tracing address with 0xCC (i.e., “int 3” instruction), utilizing the interrupt mechanism.
So, besides whether it has been loaded and the compilation options, what other differences could there be compared to the xfs driver?
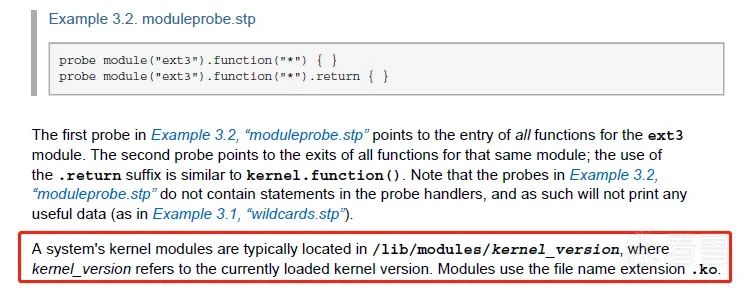
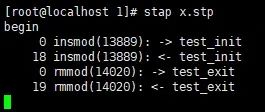
This line in the official documentation states an objective fact, but does not express that the .ko file must be placed in /lib/modules/$(uname -r)/ directory to be traced. However, the only difference I could think of between test.ko and the xfs driver was this, so I took a chance and tried it, and surprisingly, it worked:
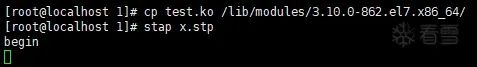
Additionally, the pleasant surprise was that executing “stat x.stp” does not depend on first executing “insmod test.ko”, meaning that the test_init() function can also be traced. But thinking about it, if the kernel module loading function cannot be traced, then what kind of “magic weapon” is systemtap claiming to be?
Three


Function Names Not Displayed
I originally thought that I could now swim freely.
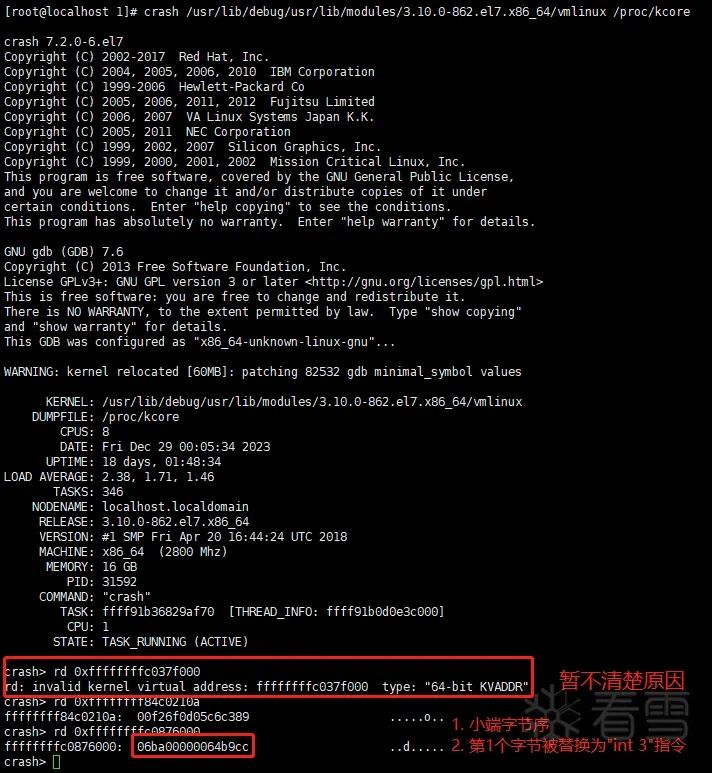
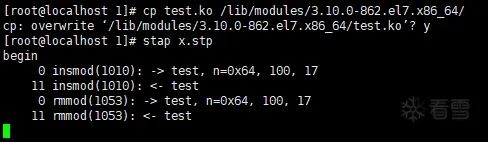
However, after triggering test_init() and test_exit() by executing “insmod test.ko” and “rmmod test”, I found that the printed content from stap was as follows:
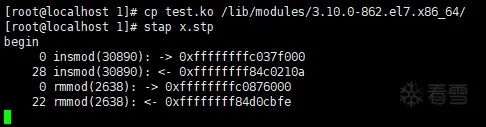
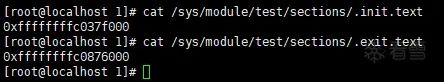
Among them, 0xffffffffc037f000 is the loading address of test_init(), and 0xffffffffc0876000 is the loading address of test_exit(). This can be confirmed before unloading test.ko in the following three ways:
① Check the loading address of the test.ko section
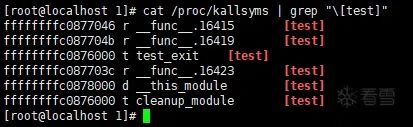
② Check the kernel symbol table for symbols belonging to the test driver and their loading addresses (Not sure why “test_init” was not seen)
③ Compare the contents of these two memory addresses with the disassembled machine code of test_init() and test_exit() (This method requires the system to have kernel debuginfo installed)
Machine code of test_exit() function:
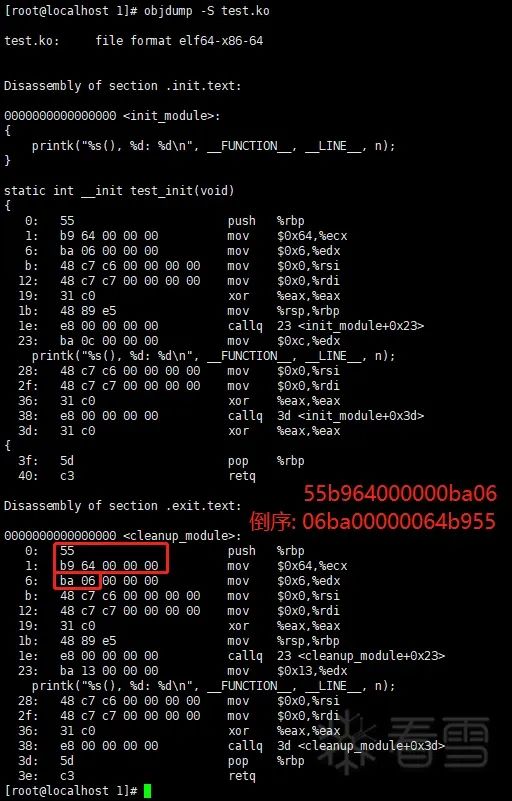
Memory view:
Confirming that the printed content shows that after “->” is the address of the traced function, I still had three additional questions:
1. Why does stap print the function address instead of the function name?
This can be solved by replacing probefunc() in the x.stp script with ppfunc(), which also avoids the phenomenon described in question 3 below:
2. Both test_init() and test_exit() functions can be traced, but why was the test() function not traced?
The fourth section will introduce this.
3. What do the different addresses after “<-” and “->” represent?
By solving question 2, let the function call a few more layers, and it can be seen that after “->” is the callee function address, and after “<-” is the caller function address.
Four


Not Tracing the test() Function
The x.stp script is clearly tracing all functions (function(“*”), but the test() function was not traced.
First, I tried adding a line in the Makefile:
ccflags-y += -g
However, I still could not trace the test() function.
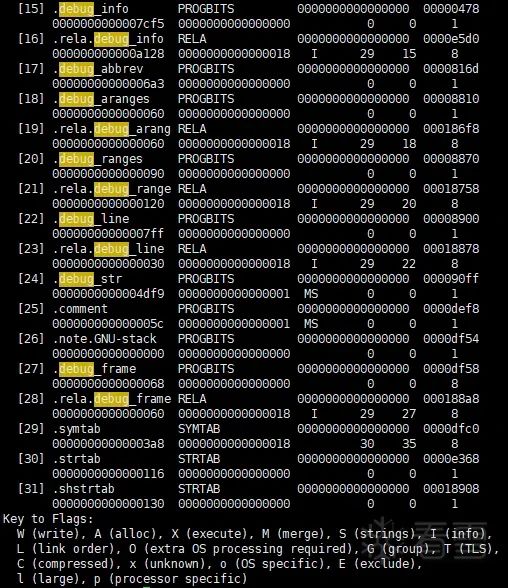
Executing “readelf -S test.ko” revealed that even without the -g compilation, test.ko already contains a debug_info section, and the number of sections is not less than when compiled with -g:
At this point, I thought I would check how the test() function was called in the init_test() and test_exit() functions:
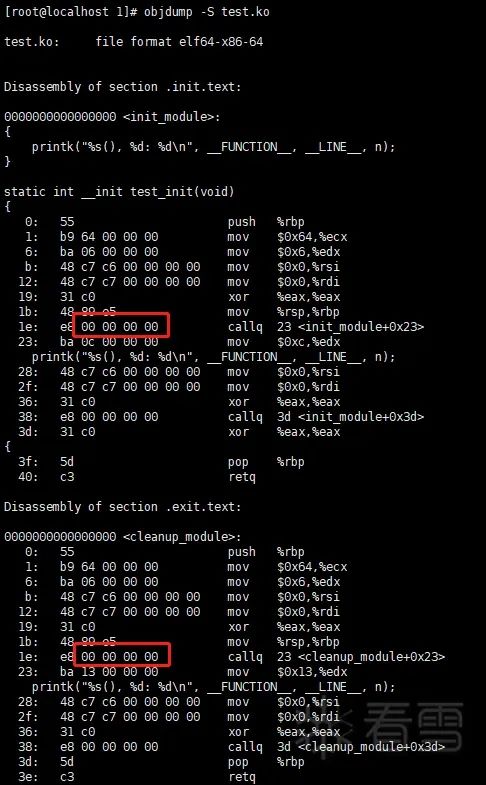
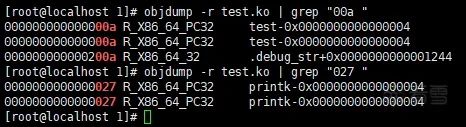
It can be seen that the call instruction to test() has an offset of 0x1e in both test_init() and test_exit() functions, so there must be a corresponding relocation at 0x1f (This requires some knowledge of linking principles; you can check out my article “10 Types of Relocation in 32-bit ELF Format” (https://bbs.kanxue.com/thread-246373.htm)”).
Ultimately, it was concluded that at 0x1f, what should have been filled with the address of the test() function was directly filled with the address of printk(), so it can be roughly inferred that since test() only calls printk() and does nothing else, it was optimized by gcc to directly call printk() during compilation.
To confirm this idea, I added a line in the Makefile:
ccflags-y += -O0
After recompiling, it can be seen that the test() function can be traced (after recompilation, the call instruction to test() is at offset 0x09):
And it can be seen that test() can now be traced:
Five


Unable to Obtain Parameters and Local Variable Values of test() Function
At this point, I estimate that everyone would not want any more surprises, but systemtap does not care whether you want it or not!
After adding the -O0 compilation option, I was able to trace the test() function, and I had a bold idea to modify x.stp to try to trace the test() function and print its parameters and local variable values:
probe module("test").function("test").call {
  printf("%s -> %s, %s, %d\n", thread_indent(1), ppfunc(), $$parms, $n)
}
However, the result was:
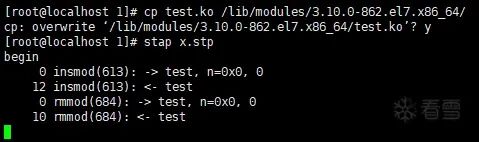
The value of n is clearly incorrect; it should be n=100!
Since -O0 surprised me, and if there are problems at optimization level 0, it would be even worse at higher optimization levels, I didn’t think of it as a potential issue at first. Later, I inadvertently removed “ccflags-y += -O0”, and found that I got “n=0x64”, so I decisively abandoned it.
However, removing “ccflags-y += -O0” brought me back to facing the problem of not tracing the test() function, but this is not a problem with systemtap, it is the fault of gcc. It can also be understood that the test() function is indeed too simple to need tracing, so as long as I make the test() function “complex”, I can “solve” this problem:
void test(int n)
{
    int m = n/10 + 7;
    printk("%s(), %d: %d, %d\n", __FUNCTION__, __LINE__, n, m);
}
However, I was once again played by systemtap:
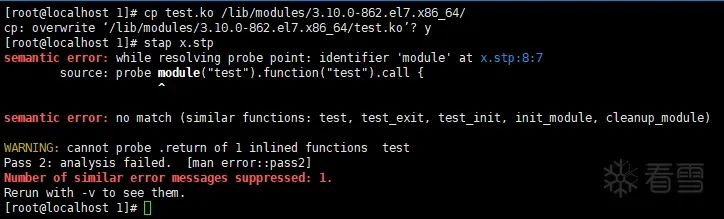
However, I calmly discovered that when executing “cat /proc/kallsyms”, I could not see either “test_init” or “test”.
For test_init, logically it should be displayed just like test_exit, but I didn’t delve into why it wasn’t displayed. However, I felt that it must be different from why test was not displayed, because test_init() has always been traceable.Thus, it can be inferred that the test() function must exist in the kernel symbol table after the driver is loaded.
So I tried to export the name of the test() function in test.c:
EXPORT_SYMBOL(test);
Finally, I achieved a satisfactory effect:

Kanxue ID: jmpcall
https://bbs.kanxue.com/user-home-815036.htm

# Previous Recommendations
1、Reverse Engineering Blockchain Smart Contracts – Contract Creation – Call Execution Process Analysis
2、Using VS2022’s MSVC to Compile LLVM16 on Windows Platform
3、God Block Killer – Unveiling the Mysteries of the World’s First Mobile Game Protection nProtect
4、Why the Base Address of DLL Files Loaded in Different Processes is the Same Under ASLR Mechanism
5、2022QWB Final RDP
6、Huawei Cup Graduate National Competition adv_lua