Disk I/O performance is a core aspect of optimizing Linux system performance, especially in high-load scenarios such as database servers, virtualization environments, or big data processing platforms. Disk I/O bottlenecks can lead to slow system responses or even service interruptions. Monitoring and debugging disk I/O performance not only helps administrators quickly locate issues but also provides data support for system tuning. This article will delve into the top 5 tools for monitoring and debugging disk I/O performance in Linux, providing detailed command examples and usage scenarios to help you master the essence of disk I/O performance analysis.

1. iostat
<span>iostat</span> is a classic tool in the sysstat package used for real-time monitoring of disk I/O and CPU usage. It presents device-level I/O statistics in a concise manner, making it the preferred tool for system administrators to troubleshoot performance issues.
In most Linux distributions, <span>iostat</span> is included in the <span>sysstat</span> package. The installation command is as follows:
# Ubuntu/Debian

sudo apt-get install sysstat

# CentOS/RHEL

sudo yum install sysstat
Core Features
- Displays read/write rates, IOPS (I/O operations per second), etc., for each disk device.
- Provides CPU usage statistics, facilitating analysis of whether I/O bottlenecks are related to CPU.
- Supports sampling intervals, suitable for long-term monitoring.
Common Commands
- “Basic Usage: View Disk I/O Statistics”
iostat -dx 2
<span>-d</span>: Displays only disk statistics.<span>-x</span>: Displays extended statistics, including<span>%util</span>(device utilization).<span>2</span>: Refreshes every 2 seconds.
Example output:
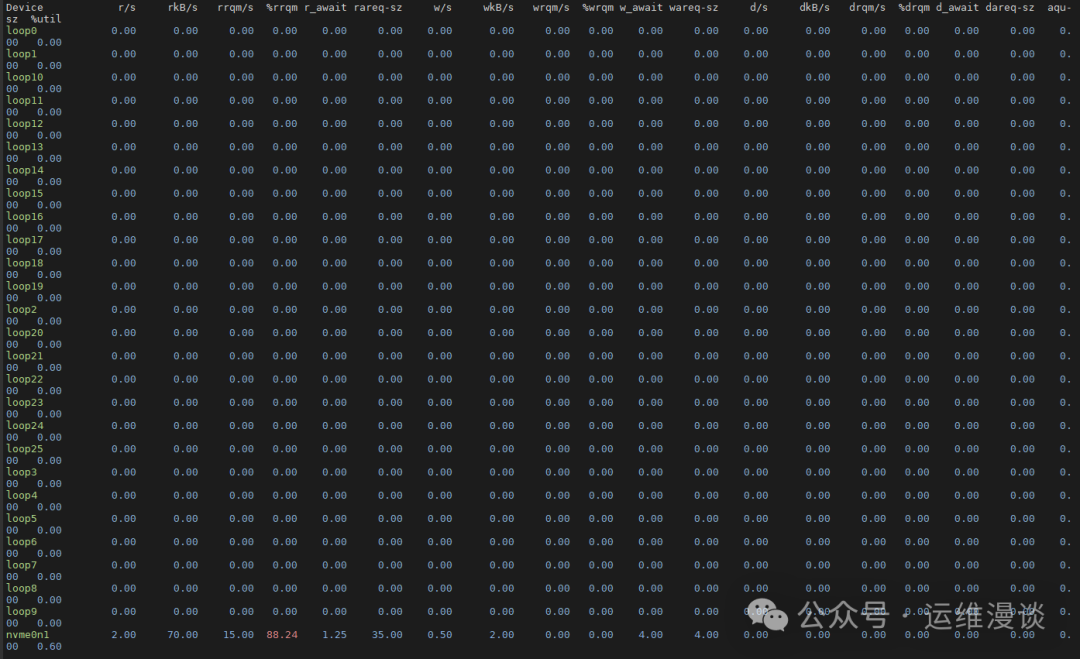
<span>r/s</span>and<span>w/s</span>: Number of read/write requests per second.<span>rkB/s</span>and<span>wkB/s</span>: Amount of read/write data per second (KB).<span>%util</span>: Percentage of time the device is busy; close to 100% indicates a potential I/O bottleneck.
- “Monitor Specific Device”
iostat -dx /dev/sda 2
Displays statistics only for <span>/dev/sda</span>.
- “Display Timestamps for Tracking”
iostat -dxt 2
<span>-t</span> adds timestamps for easier recording and analysis.
Usage Scenarios
- “Quickly Troubleshoot I/O Bottlenecks”: When the system is slow, use
<span>iostat -dx 2</span>to check if<span>%util</span>is close to 100%. - “Long-term Monitoring”: Combine with scripts and logging tools (like
<span>cron</span>) to regularly collect<span>iostat</span>output for trend analysis. - “Relate to CPU Performance”: Use
<span>iostat -c</span>to view CPU statistics and determine if I/O waits are caused by CPU overload.
Advantages and Limitations
- “Advantages”: Lightweight, easy to use, suitable for quick diagnostics.
- “Limitations”: Provides only device-level statistics, cannot delve into process or file-level details.
2. iotop
<span>iotop</span> is an interactive tool similar to <span>top</span>, focused on monitoring disk I/O usage by each process. It helps you quickly identify which process is consuming a lot of disk resources.
Installation
# Ubuntu/Debian

sudo apt-get install iotop

# CentOS/RHEL

sudo yum install iotop
Core Features
- Real-time display of read/write rates for each process.
- Supports filtering by specific users or processes.
- Provides an interactive interface for dynamic observation.
Common Commands
- “Start iotop”
sudo iotop
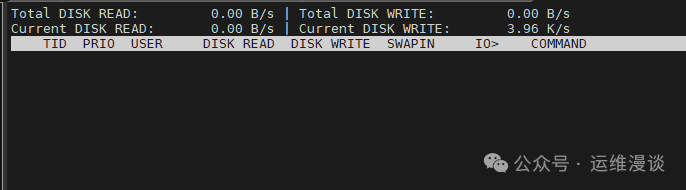
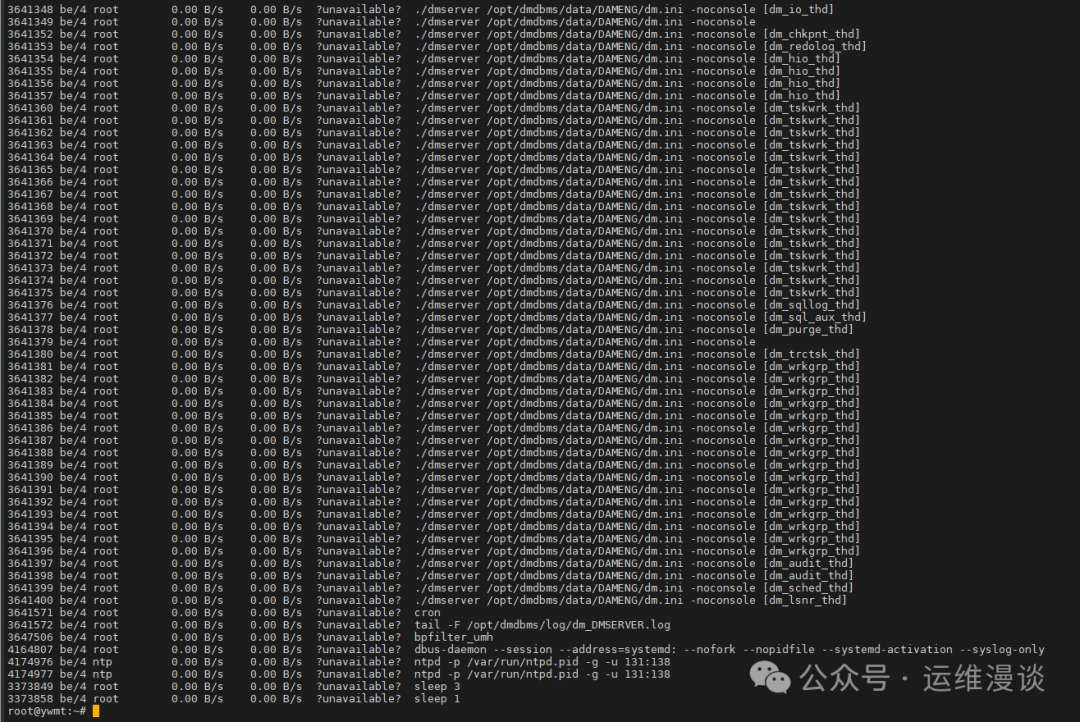
Requires root privileges; upon starting, it displays an interface similar to <span>top</span>:
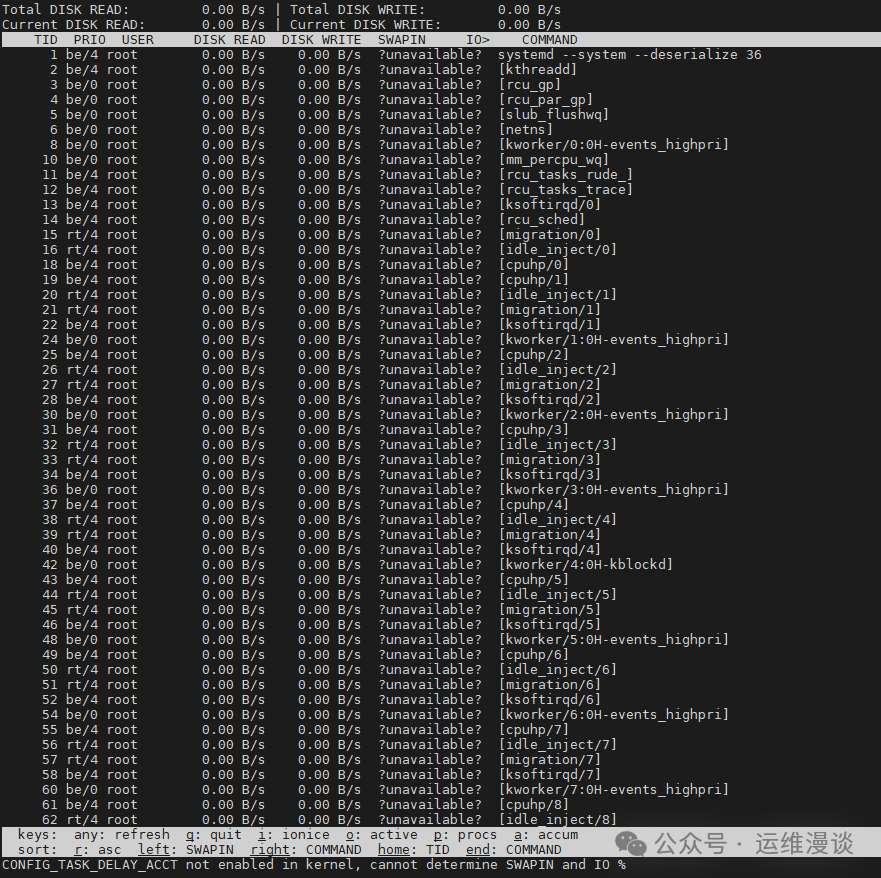
<span>DISK READ</span>and<span>DISK WRITE</span>: Read/write rates for the process.<span>IO></span>: Percentage of I/O priority usage.
- “Show Only Active I/O Processes”
sudo iotop -o
<span>-o</span> filters out processes with no I/O activity.
- “Monitor Specific User”
sudo iotop -u mysql
Displays only the I/O of processes belonging to the <span>mysql</span> user.
- “Batch Mode”
sudo iotop -b -n 2
<span>-b</span>: Non-interactive mode, suitable for scripts.<span>-n 2</span>: Exits after sampling 2 times.
Usage Scenarios
- “Identify High I/O Processes”: When
<span>iostat</span>shows the disk is busy, use<span>iotop -o</span>to find the specific process. - “Database Optimization”: Monitor I/O behavior of MySQL or PostgreSQL, adjusting cache or query strategies.
- “Batch Analysis”: Use batch mode combined with log analysis tools to generate I/O usage reports.
Advantages and Limitations
- “Advantages”: Intuitive process-level view, highly interactive.
- “Limitations”: Requires root privileges and has limited analysis capabilities for complex I/O stacks.
3. dstat
<span>dstat</span> is a highly customizable performance monitoring tool that supports simultaneous viewing of various metrics such as disk I/O, CPU, and network. Compared to <span>iostat</span>, it is more flexible and suitable for scenarios requiring comprehensive analysis.
Installation
# Ubuntu/Debian
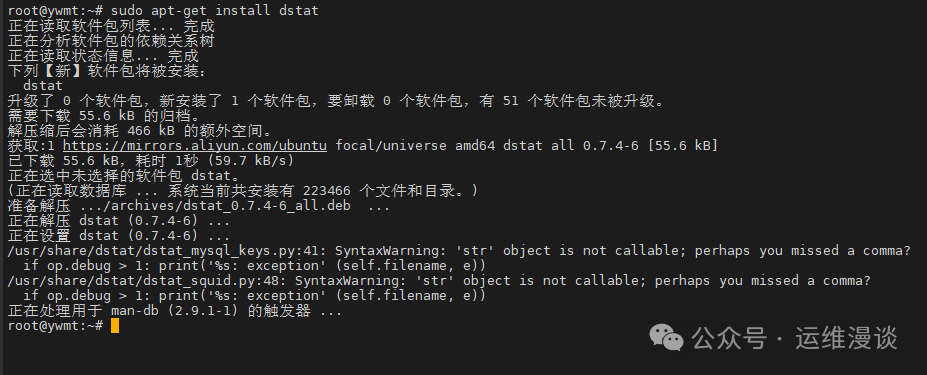
sudo apt-get install dstat
# CentOS/RHEL
sudo yum install dstat
Core Features
- Supports modular plugins, allowing users to select monitoring metrics.
- Provides color output for easier reading.
- Suitable for real-time and historical data analysis.
Common Commands
- “Monitor Disk I/O”
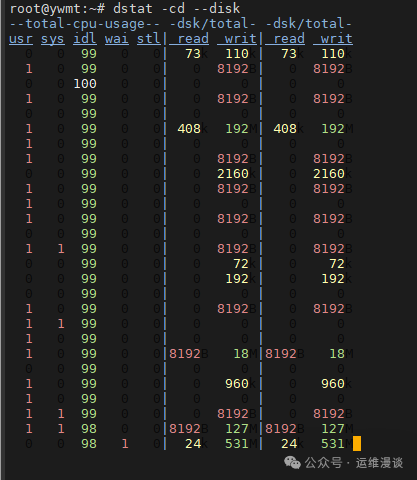
dstat -cd --disk
<span>-c</span>: Displays CPU statistics.<span>-d</span>: Displays disk I/O statistics.<span>--disk</span>: Refines disk statistics.
Example output:
- “Monitor Specific Disk”
dstat -cd --disk --disk-tps sda
<span>--disk-tps</span> displays the transactions per second for the specified disk (e.g., <span>sda</span>).
- “Output to CSV File”
dstat -cd --disk --output /tmp/dstat.csv
Saves data in CSV format for later analysis.
- “Add Timestamps”
dstat -tcd --disk
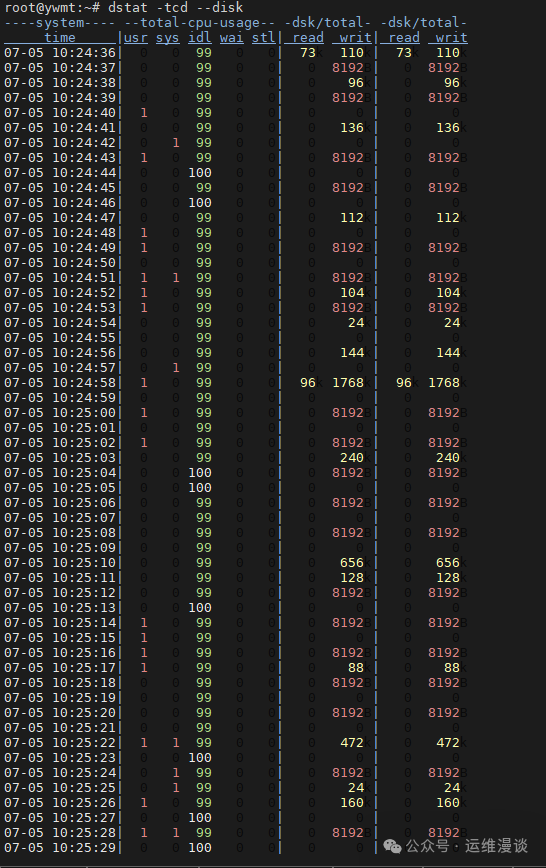
<span>-t</span> adds timestamps.
Usage Scenarios
- “Comprehensive Performance Analysis”: Monitor CPU and disk I/O simultaneously to determine the source of performance bottlenecks.
- “Generate Reports”: Use
<span>--output</span>to export data and generate performance charts with visualization tools. - “Real-time Debugging”: Quickly identify anomalies through color output.
Advantages and Limitations
- “Advantages”: Highly customizable, supports multiple metrics.
- “Limitations”: Outputs a lot of information, which may require some learning curve.
4. blktrace
<span>blktrace</span> is a powerful block-level I/O tracing tool that captures detailed events of disk I/O. It is suitable for scenarios requiring in-depth analysis of I/O behavior, such as kernel debugging or performance optimization.
Installation
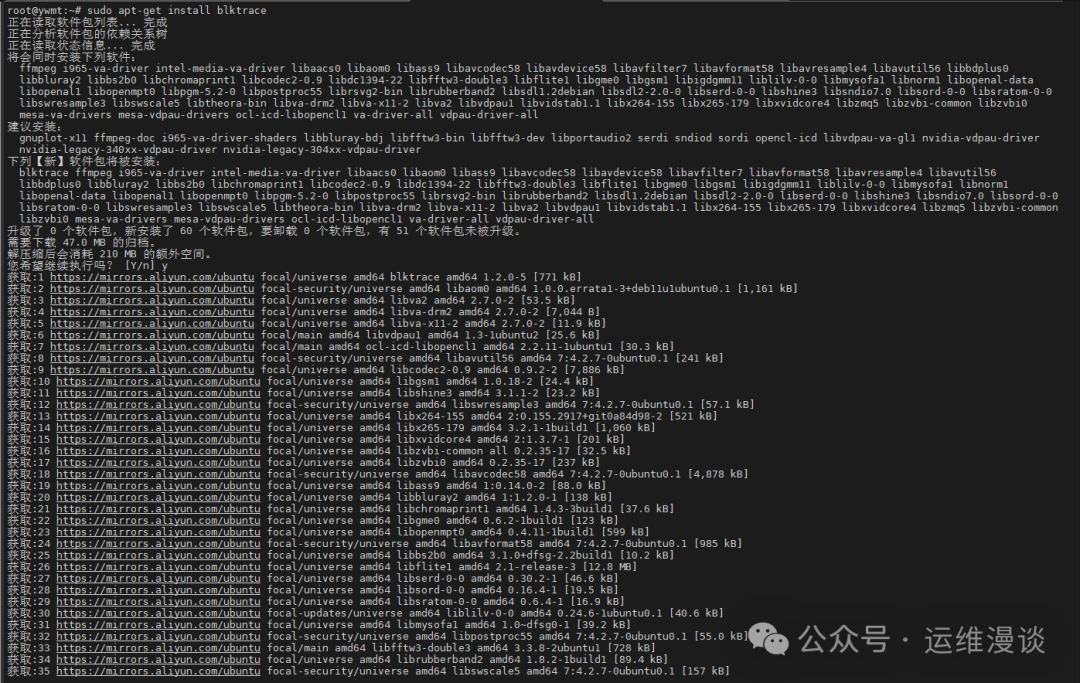
# Ubuntu/Debian

sudo apt-get install blktrace

# CentOS/RHEL

sudo yum install blktrace
Core Features
- Captures all I/O requests and completion events for block devices.
- Supports real-time and offline analysis.
- Provides rich tools (like
<span>blkparse</span>) to parse trace data.
Common Commands
- “Capture I/O Events for sda”
sudo blktrace -d /dev/sda -o sda_trace
<span>-d</span>: Specifies the device.<span>-o</span>: Specifies the output file prefix.
Generates files like <span>sda_trace.blktrace.0</span>.
- “Parse Trace Data”
sudo blkparse -i sda_trace -o sda_trace.txt
Converts the binary trace file into a readable text format.
- “View Real-time Trace”
sudo blktrace -d /dev/sda | blkparse -i -
Directly parses and displays real-time trace data.
- “Generate Statistical Report”
sudo btt -i sda_trace
<span>btt</span> (Block Trace Timeline) analyzes trace data to generate statistics on I/O latency, queue depth, etc.
Usage Scenarios
- “Kernel-level Debugging”: Analyze the behavior of I/O schedulers (like CFQ, deadline).
- “Latency Analysis”: Use
<span>btt</span>to locate the source of I/O request latency. - “Storage Optimization”: Adjust RAID or filesystem parameters based on trace data.
Advantages and Limitations
- “Advantages”: Provides low-level I/O details, suitable for advanced users.
- “Limitations”: Complex operations, large output data, requires analysis with other tools.
5. perf
<span>perf</span> is a powerful performance analysis tool built into the Linux kernel. It can monitor CPU and memory, and analyze disk I/O performance through the <span>block</span> subsystem.
Installation
<span>perf</span> is usually installed with kernel tools:
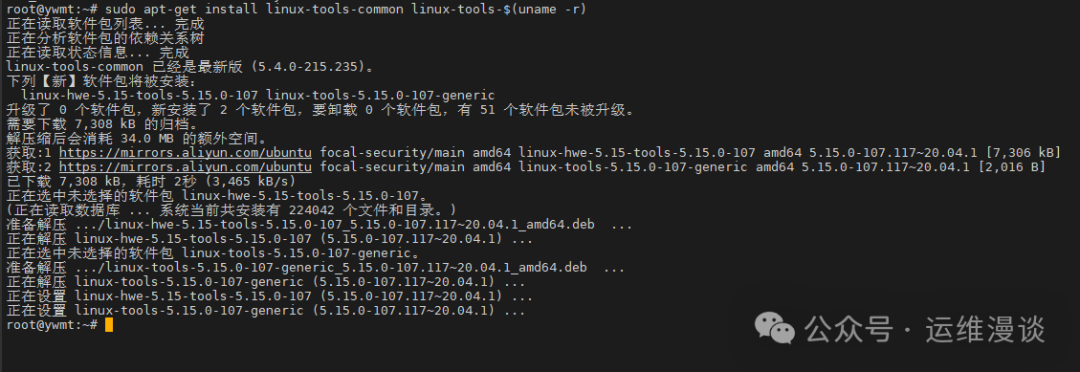
# Ubuntu/Debian

sudo apt-get install linux-tools-common linux-tools-$(uname -r)

# CentOS/RHEL

sudo yum install perf
Core Features
- Tracks block device I/O events.
- Supports sampling and statistical analysis.
- Provides rich subcommands covering various performance metrics.
Common Commands
- “Monitor Block I/O Events”
sudo perf stat -e block:* sleep 10
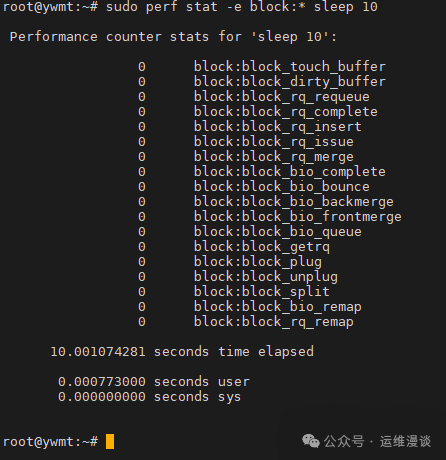
Statistics of block I/O events over 10 seconds.
- “Record I/O Trace”
sudo perf record -e block:block_rq_issue,block:block_rq_complete -a
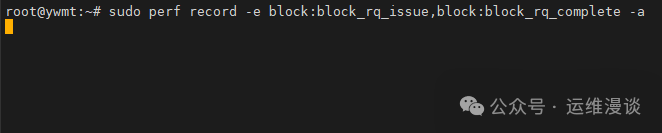
<span>-e</span>: Specifies block I/O events.<span>-a</span>: System-wide tracing.
- “Analyze Trace Data”
sudo perf report
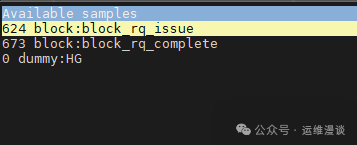
Displays a detailed report of the trace.
- “Real-time I/O Analysis”
sudo perf trace -e block:*
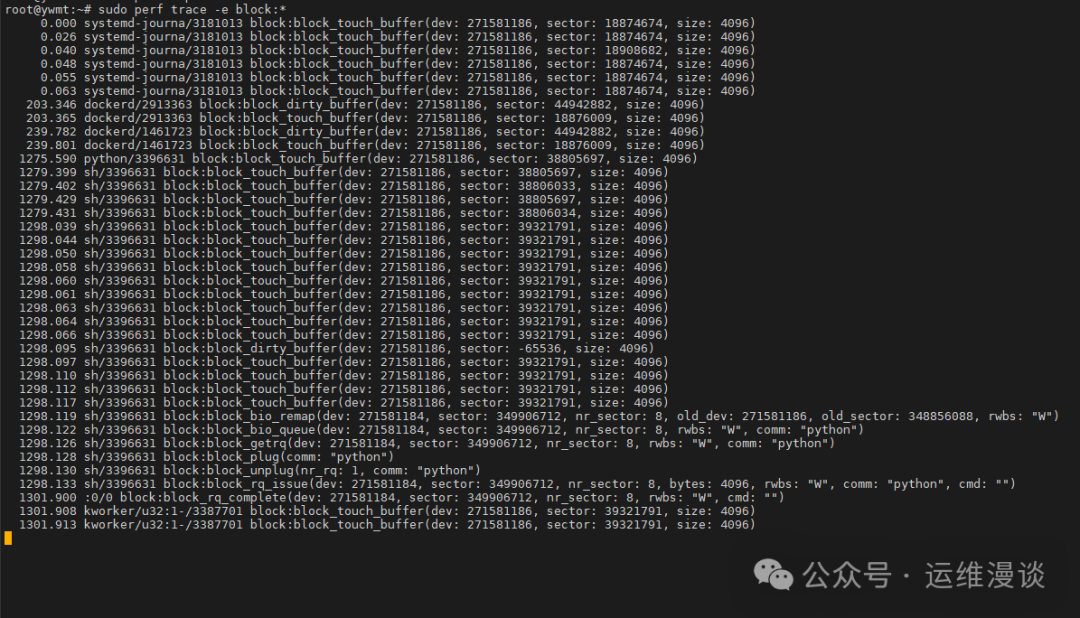
Real-time display of block I/O events.
Usage Scenarios
- “Complex System Analysis”: Analyze multi-dimensional performance issues by combining CPU and I/O data.
- “Kernel Development”: Trace block I/O events to optimize drivers or schedulers.
- “Advanced Diagnostics”: Use
<span>perf</span>for in-depth analysis when other tools fail to locate issues.
Advantages and Limitations
- “Advantages”: Comprehensive functionality, suitable for complex scenarios.
- “Limitations”: Steep learning curve, requires familiarity with kernel events.
Tool Comparison
| Tool | Level | Main Features | Suitable Scenarios | Complexity |
|---|---|---|---|---|
| iostat | Device | Device-level I/O statistics | Quickly troubleshoot bottlenecks | Low |
| iotop | Process | Process-level I/O monitoring | Identify high I/O processes | Medium |
| dstat | Device/Comprehensive | Multi-metric comprehensive monitoring | Comprehensive performance analysis | Medium |
| blktrace | Block Level | Low-level I/O tracing | Kernel debugging, latency analysis | High |
| perf | Block Level/System | Comprehensive performance analysis | Complex system diagnostics, kernel development | High |
“Selection Recommendations”:
- “Beginners”: Start with
<span>iostat</span>and<span>iotop</span>to quickly grasp the basics of I/O monitoring. - “Intermediate Users”: Combine with
<span>dstat</span>for multi-dimensional analysis to improve diagnostic efficiency. - “Advanced Users”: Use
<span>blktrace</span>and<span>perf</span>to delve into block-level issues and solve complex problems.
Best Practices
-
“Combine Tools”:
- First use
<span>iostat</span>to confirm device-level bottlenecks, then use<span>iotop</span>to locate processes. - For complex issues, use
<span>blktrace</span>or<span>perf</span>for in-depth tracing.
“Monitoring Frequency and Performance Overhead”:
- High-frequency sampling (e.g.,
<span>iostat -dx 1</span>) may increase system load; in production environments, it is recommended to extend intervals appropriately. <span>blktrace</span>and<span>perf</span>generate large amounts of data; ensure sufficient disk space.
“Combine Contextual Analysis”:
- Disk I/O bottlenecks may relate to the filesystem (e.g., ext4, XFS), RAID configuration, or application design, requiring comprehensive consideration.
“Regular Baseline Testing”:
- Record baseline data (e.g.,
<span>iostat</span>and<span>dstat</span>output) during normal system operation for comparison during anomalies.

Important! Operations and Maintenance Discussion Group Open for External Access!Scan to add the editor’s WeChat, apply to join the group. ▲ Long press to join the group