- 1. Data Analysis: Pandas Time Series Forecasting
- Principle Explanation
- Practical Case: Sales Data Trend Forecasting
- 2. Machine Learning: Scikit-learn Model Deployment
- Principle Explanation
- Practical Case: Housing Price Prediction API Deployment
- 3. Web Development: Django REST Framework Optimization
- Principle Explanation
- Practical Case: Blog API Performance Optimization
- 4. Automated Operations: Selenium Web Automation
- Principle Explanation
- Practical Case: Automatically Log into a Website and Scrape Data
- 5. Quantitative Trading: TA-Lib Strategy Backtesting
- Principle Explanation
- Practical Case: Stock Moving Average Strategy Backtesting
- 6. Comprehensive Practice: Housing Price Prediction Tool
- Core Code Implementation
- Summary: Key Points of Python Specialized Practices
- Postscript
Specialized Practices in Python: From Data Analysis to Model Deployment
Mastering Python’s practical capabilities across various fields is a necessary path for advancing programmers.
This article will delve into specialized practices of Python in data analysis, machine learning, web development, automated operations, and quantitative trading, with each module containing straightforward principle explanations and complete practical code to help developers quickly enhance their engineering skills.
1. Data Analysis: Pandas Time Series Forecasting
Principle Explanation
Time series data is a collection of data points arranged in chronological order (e.g., stock prices, temperature records). Moving Average Method is the simplest forecasting method, which reveals trends by calculating the average of recent data to eliminate random fluctuations.
Practical Case: Sales Data Trend Forecasting
import pandas as pd
import matplotlib
matplotlib.use('Agg')  # Use non-interactive backend (to solve tostring_rgb error)
import matplotlib.pyplot as plt


# Simulated sales data (date and sales amount)
data = {'date': pd.date_range(start='2025-08-01', periods=30, freq='D'),
        'sales': [120, 135, 128, 150, 145, 160, 158, 170, 165, 180,
                  175, 190, 185, 200, 210, 205, 220, 215, 230, 240,
                  235, 250, 245, 260, 255, 270, 265, 280, 290, 285]}


df = pd.DataFrame(data)
df.set_index('date', inplace=True)

# Calculate 7-day moving average
df['7d_MA'] = df['sales'].rolling(window=7).mean()
# Visualize results
plt.figure(figsize=(12, 6))
plt.rcParams['font.sans-serif'] = ['SimHei']  # or 'Microsoft YaHei'
plt.rcParams['axes.unicode_minus'] = False
plt.plot(df['sales'], label='Actual Sales', marker='o')
plt.plot(df['7d_MA'], label='7-Day Moving Average', color='red', linewidth=2)
plt.title('Sales Data Trend Analysis')
plt.xlabel('Date')
plt.ylabel('Sales Amount')
plt.legend()
plt.grid(True)
# Save to file
plt.savefig('2025-08-01_sale_output.png')
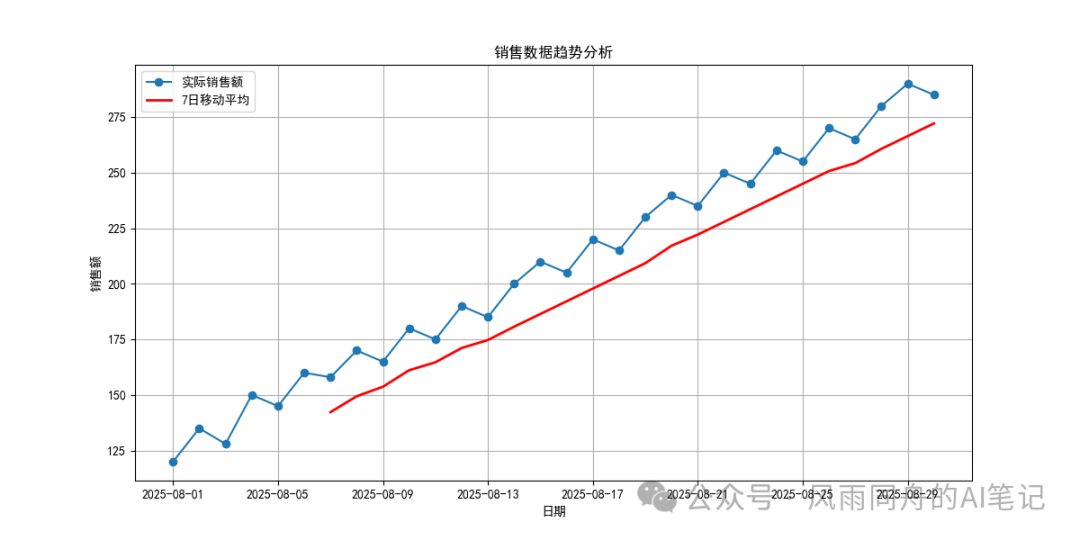
Key Techniques:
<span>rolling(window).mean()</span>calculates the moving average- The window size determines the degree of smoothing (the larger the window, the smoother the trend)
2. Machine Learning: Scikit-learn Model Deployment
Principle Explanation
Model deployment is the process of putting a trained machine learning model into a production environment. API Service is the most common method, encapsulating the model with Flask/FastAPI to receive HTTP requests and return prediction results.
Practical Case: Housing Price Prediction API Deployment
from flask import Flask, request, jsonify
import joblib
from sklearn.datasets import fetch_california_housing

# Train model (in actual projects, training must be completed first)
data = fetch_california_housing()
X, y = data.data, data.target
model = RandomForestRegressor().fit(X, y)
joblib.dump(model, 'house_price_model.pkl')

# Deploy API
app = Flask(__name__)
model = joblib.load('house_price_model.pkl')

@app.route('/predict', methods=['POST'])
def predict():
    data = request.json['features']
    prediction = model.predict([data])
    return jsonify({'price': round(prediction[0], 2)})

if __name__ == '__main__':
    app.run(host='0.0.0.0', port=5000)
Test Request:
curl -X POST http://localhost:5000/predict \
     -H "Content-Type: application/json" \
     -d '{"features": [3.5, 2.1, 15, 2100, 1.2, 37.8, -122.2]}'

# Example Response: {"price": 285000.75}
Deployment Optimization:
- Use Docker for containerization to ensure environment consistency
- Implement load balancing with Nginx
3. Web Development: Django REST Framework Optimization
Principle Explanation
The core optimization points of Django REST Framework (DRF) are:
- Pagination Control: Reduces the amount of data in a single response
- Query Optimization: Use
<span>select_related/prefetch_related</span>to reduce the number of database queries - Cache Mechanism: Cache results of high-frequency requests
Practical Case: Blog API Performance Optimization
# views.py
from rest_framework.pagination import PageNumberPagination
from rest_framework.response import Response

class OptimizedBlogView(APIView):
    pagination_class = PageNumberPagination
    page_size = 20  # 20 items per page

    @cache_page(60 * 5)  # Cache for 5 minutes
    def get(self, request):
        # Optimize query: fetch associated author information in one go
        blogs = Blog.objects.prefetch_related('author').all()

        # Pagination handling
        paginator = self.pagination_class()
        page = paginator.paginate_queryset(blogs, request)

        # Serialize data
        serializer = BlogSerializer(page, many=True)
        return paginator.get_paginated_response(serializer.data)

# Add route in urls.py
path('optimized-blogs/', OptimizedBlogView.as_view())
Performance Comparison:
| Optimization Measure | Request Latency (ms) | Database Query Count |
|---|---|---|
| Unoptimized | 320 | N+1 (101 times) |
| Optimized | 85 | 2 |
4. Automated Operations: Selenium Web Automation
Principle Explanation
Selenium simulates user operations through browser drivers:
- Locate elements (ID/XPath/CSS selectors)
- Perform clicks, inputs, and other operations
- Retrieve page data
Practical Case: Automatically Log into a Website and Scrape Data
from selenium import webdriver
from selenium.webdriver.common.by import By
from selenium.webdriver.support.ui import WebDriverWait
from selenium.webdriver.support import expected_conditions as EC

driver = webdriver.Chrome()
driver.get("https://example.com/login")

# Explicitly wait for element to load
username = WebDriverWait(driver, 10).until(
    EC.presence_of_element_located((By.ID, "username"))
)
username.send_keys("your_username")

password = driver.find_element(By.ID, "password")
password.send_keys("your_password")
driver.find_element(By.XPATH, "//button[@type='submit']").click()

# After logging in, retrieve data
WebDriverWait(driver, 10).until(
    EC.title_contains("Dashboard")
)
data_element = driver.find_element(By.CLASS_NAME, "data-panel")
print("Retrieved Data:", data_element.text)

driver.quit()  # Close browser
Key Techniques:
- Use explicit waits (
<span>WebDriverWait</span>) instead of<span>sleep</span> - Prefer using ID selectors to improve locating efficiency
- Run in headless mode:
<span>options = webdriver.ChromeOptions(); options.add_argument("--headless")</span>
5. Quantitative Trading: TA-Lib Strategy Backtesting
Principle Explanation
Dual Moving Average Strategy:
- Short-term moving average (e.g., 5 days) crosses above long-term moving average (e.g., 20 days) → Buy signal (Golden Cross)
- Short-term moving average crosses below long-term moving average → Sell signal (Death Cross)
Practical Case: Stock Moving Average Strategy Backtesting
import talib
import pandas as pd
import yfinance as yf

# Get stock data
data = yf.download('AAPL', start='2024-01-01', end='2024-12-31')

# Calculate moving averages
data['MA5'] = talib.SMA(data['Close'], timeperiod=5)
data['MA20'] = talib.SMA(data['Close'], timeperiod=20)

# Generate trading signals
data['Signal'] = 0
data.loc[data['MA5'] > data['MA20'], 'Signal'] = 1  # Buy
data.loc[data['MA5'] < data['MA20'], 'Signal'] = -1 # Sell

# Calculate returns
data['Return'] = data['Close'].pct_change()
data['Strategy_Return'] = data['Return'] * data['Signal'].shift(1)

# Visualize results
data[['Close', 'MA5', 'MA20']].plot(figsize=(12,6))
(data['Strategy_Return'] + 1).cumprod().plot(label='Strategy Return', secondary_y=True)
Strategy Optimization Directions:
- Add stop-loss mechanisms (e.g., close position at maximum drawdown of 10%)
- Combine RSI indicators to filter false signals
6. Comprehensive Practice: Housing Price Prediction Tool
Project Structure:
house-price-predictor/
├── model/
│   ├── train.py          # Model training script
│   └── model.pkl         # Trained model
├── app.py                # Flask application
├── templates/
│   └── index.html        # Frontend page
└── requirements.txt      # Dependency list
Core Code Implementation
# train.py - Model Training
from sklearn.ensemble import RandomForestRegressor
from sklearn.datasets import fetch_california_housing
import pandas as pd

data = fetch_california_housing()
df = pd.DataFrame(data.data, columns=data.feature_names)
df['PRICE'] = data.target

# Key Feature Extraction
features = ['MedInc', 'HouseAge', 'AveRooms', 'Latitude', 'Longitude']
X = df[features]
y = df['PRICE']

model = RandomForestRegressor(n_estimators=100)
model.fit(X, y)

# Frontend page form
# templates/index.html
<form action="/predict" method="POST">
  <input type="number" name="MedInc" placeholder="Median Income" step="0.01" required>
  <input type="number" name="HouseAge" placeholder="House Age" required>
  ...
  <button type="submit">Predict</button>
</form>

# app.py - Prediction Interface
@app.route('/predict', methods=['POST'])
def predict():
    features = [float(request.form['MedInc']),
                float(request.form['HouseAge']),
                ...]
    prediction = model.predict([features])
    return f"Predicted House Price: ${prediction[0]*100000:.2f}"
Deployment Commands:
pip install -r requirements.txt
python train.py  # Generate model.pkl
python app.py    # Start service
Summary: Key Points of Python Specialized Practices
| Field | Core Libraries | Key Capabilities |
|---|---|---|
| Data Analysis | Pandas/Matplotlib | Data Cleaning, Visualization, Trend Forecasting |
| Machine Learning | Scikit-learn | Model Training, Evaluation, Deployment |
| Web Development | Django/Flask | API Design, Performance Optimization, Security Protection |
| Automated Operations | Selenium | Web Operations, Data Collection, Process Automation |
| Quantitative Trading | TA-Lib/yfinance | Indicator Calculation, Strategy Backtesting, Risk Management |
Complete project code reference: https://blog.csdn.net/qq_42978535/article/details/142821109 Advanced reference for machine learning deployment: https://cloud.tencent.com/developer/article/2463852
Learning Suggestions:
- Master 1-2 core libraries in each field first
- Start with simple projects and gradually increase complexity
- Emphasize deployment capabilities and learn containerization technologies
- Participate in open-source projects to learn engineering practices
After mastering these specialized skills, you will have the ability to solve complex business problems and truly become a full-stack Python developer!
Postscript
Thus, the entire update of “Python Programming Compass: 24-Dimensional Navigation Practical Development” is complete. The code for these 24 lectures will be submitted to GitHub later for readers to debug. Future updates will focus on the following areas:
- Practical sharing of new features in Spring Boot
- Practical development of Spring Cloud
- Practical applications of Python in data analysis, machine learning, and deep learning
- Practical sharing of AI
- Practical sharing of design patterns (Java & Python versions)
- Operations in Linux, Kubernetes, etc.
Systematically organizing fragmented knowledge and adhering to the principle that practical experience leads to true understanding. On one hand, it facilitates personal learning, and on the other, it allows sharing with more people and establishing connections.
For more technical content, please follow the WeChat public account “AI Notes in Stormy Weather“~
[Reprint Notice]:Please indicate the original source and author information when reprinting