
Introduction: In actual work, we often encounter situations where hardware materials are replaced, among which eMCP is quite common. This includes the selection of materials at the beginning of a project, comparing multiple materials for testing, or during project iterations when old materials are no longer produced, verifying whether new materials can meet requirements. Here, the author summarizes methods and thoughts based on personal work experience and learning during the testing process.
1. About eMCP
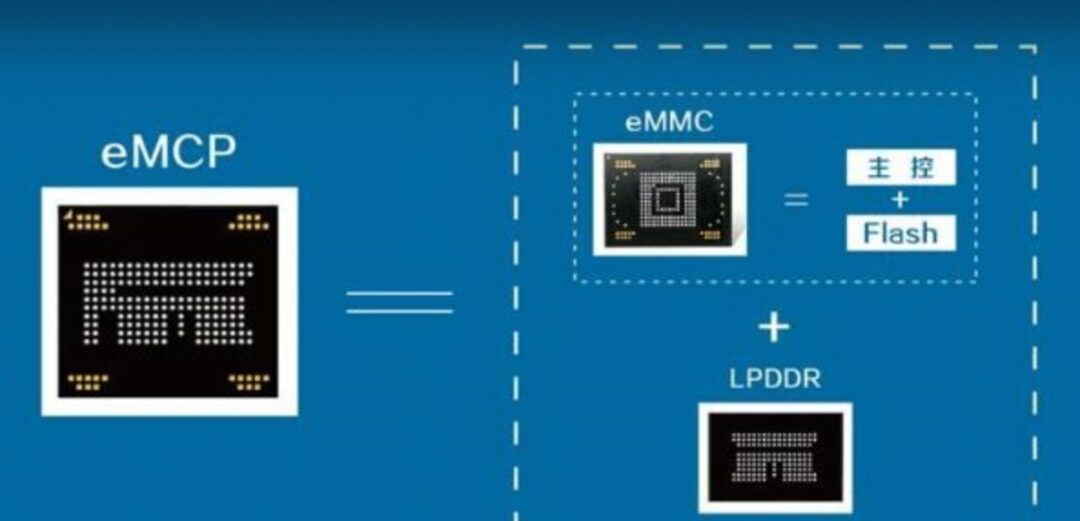
eMCP is a more advanced storage device compared to eMMC. It integrates eMMC and LPDDR into one package, reducing size while also minimizing circuit link design, primarily used in smartphones priced above a thousand yuan.
2. Performance Testing and Reflections on Issues
There are many methods for testing IO read and write speeds, such as: the commonly used dd command under Linux, iozone, fio, and H2testw under Windows. Below, we introduce several common testing tools, the issues encountered during their use, thoughts, applicable scenarios, and analysis methods.
/mnt/sdcard # dd --helpUsage: dd [OPERAND]... or: dd OPTIONCopy a file, converting and formatting according to the operands. bs=BYTES read and write up to BYTES bytes at a time (default: 512); overrides ibs and obs cbs=BYTES convert BYTES bytes at a time conv=CONVS convert the file as per the comma separated symbol list count=N copy only N input blocks ibs=BYTES read up to BYTES bytes at a time (default: 512) if=FILE read from FILE instead of stdin iflag=FLAGS read as per the comma separated symbol list obs=BYTES write BYTES bytes at a time (default: 512) of=FILE write to FILE instead of stdout oflag=FLAGS write as per the comma separated symbol list seek=N skip N obs-sized blocks at start of output skip=N skip N ibs-sized blocks at start of input status=LEVEL The LEVEL of information to print to stderr; 'none' suppresses everything but error messages, 'noxfer' suppresses the final transfer statistics, 'progress' shows periodic transfer statisticsDetailed Explanation:
-
if=xxx Read from xxx, e.g., if=/dev/zero, this device endlessly provides 0 (does not generate read disk IO).
-
of=xxx Write to xxx, can write to files or raw devices. For example, of=/dev/null, the “black hole”, equivalent to a write-only file. All content written to it will be lost forever (does not generate write disk IO).
-
bs=1M Size of each read or write, i.e., block size.
-
count=xxx Total number of blocks to read/write.
Familiarizing with Two Special Devices:
-
/dev/null: Recycle bin, bottomless pit.
-
/dev/zero: Generates characters.
Based on the –help prompt, we can summarize a commonly used testing template:
# Write Speed dd if=/dev/zero of=/sdcard/test bs=1M count=1000
# Read Speed dd if=/sdcard/test of=/dev/null bs=1M count=1000
Preliminary Testing
# Write Speed Test 1GB/mnt/sdcard # dd if=/dev/zero of=/sdcard/test bs=1M count=10001000+0 records in1000+0 records out1048576000 bytes (1.0 GB, 1000 MiB) copied, 89.1365 s, 11.8 MB/s
# Write Speed Test 100M/mnt/sdcard # dd if=/dev/zero of=/sdcard/test bs=1M count=100100+0 records in100+0 records out104857600 bytes (105 MB, 100 MiB) copied, 3.11532 s, 33.7 MB/s
Here, a significant discrepancy in test speed was discovered.
Reflections on Issues
Issue 1: For the same device, what is the actual test result we need when the speed difference between the 1GB and 100MB tests is too large?
To address this issue, we first need to understand the memory caching mechanism. Simply put, it is whether the dd command has allowed the system to actually write the file to the disk before completion.
Then we can conduct the following test:
/mnt/sdcard # free -h total used free shared buff/cache availableMem: 958M 257M 505M 2.0M 196M 684MSwap: 255M 0B 255M/mnt/sdcard # dd if=/dev/zero of=/sdcard/test bs=1M count=100100+0 records in100+0 records out104857600 bytes (105 MB, 100 MiB) copied, 1.88379 s, 55.7 MB/s/mnt/sdcard # free -h total used free shared buff/cache availableMem: 958M 257M 393M 2.0M 307M 683MSwap: 255M 0B 255MTherefore, the above command merely reads this 128MB of data into the memory buffer (write cache). So the speed you get will be extremely fast. Because what dd provides you is only the read speed; the system only starts writing data to the disk after dd completes, but you won’t see that speed.
At this point, we find the parameter –help reveals this option:
fdatasync physically write output file data before finishingBy adding this parameter, the dd command will actually perform a “sync” operation at the end, so the time you get reflects the time needed to read the 128MB of data into memory and write it to disk, making the calculated time more realistic.
/mnt/sdcard # dd bs=1M count=128 if=/dev/zero of=test conv=fdatasync128+0 records in128+0 records out134217728 bytes (134 MB, 128 MiB) copied, 8.65137 s, 15.5 MB/sIssue 2: By using the method of adding the parameter conv=fdatasync, is the write cache (write cache) also utilized?
We can conduct the following test:
/mnt/sdcard # free -h total used free shared buff/cache availableMem: 958M 258M 504M 2.0M 196M 683MSwap: 255M 0B 255M/mnt/sdcard # dd bs=1M count=128 if=/dev/zero of=test conv=fdatasync128+0 records in128+0 records out134217728 bytes (134 MB, 128 MiB) copied, 7.93997 s, 16.9 MB/s/mnt/sdcard # free -h total used free shared buff/cache availableMem: 958M 258M 360M 2.0M 339M 682MSwap: 255MFrom the test results, the cache has clearly increased. This means that the write cache was indeed utilized.
Issue 3: How can we skip the write cache?
I found two different answers online to conduct the following tests:
-
oflag=direct
-
oflag=dsync
First, let’s look at the explanation from –help
direct use direct I/O for datadsync use synchronized I/O for dataFrom the explanation, they seem similar. Let’s conduct a test:
Test 1:
/mnt/sdcard # free -h total used free shared buff/cache availableMem: 958M 257M 503M 2.0M 197M 683MSwap: 255M 0B 255M/mnt/sdcard # dd bs=1M count=128 if=/dev/zero of=test oflag=direct128+0 records in128+0 records out134217728 bytes (134 MB, 128 MiB) copied, 8.62906 s, 15.6 MB/s/mnt/sdcard # free -h total used free shared buff/cache availableMem: 958M 257M 502M 2.0M 198M 683MSwap: 255M 0B 255MTest 2:
/mnt/sdcard # free -h total used free shared buff/cache availableMem: 958M 258M 504M 2.0M 196M 683MSwap: 255M 0B 255M/mnt/sdcard # dd bs=1M count=128 if=/dev/zero of=test oflag=dsync128+0 records in128+0 records out134217728 bytes (134 MB, 128 MiB) copied, 9.72236 s, 13.8 MB/s/mnt/sdcard # free -h total used free shared buff/cache availableMem: 958M 258M 361M 2.0M 338M 682MSwap: 255MFrom the test results, oflag=direct bypassed the memory cache. oflag=dsync did not. However, the speed was indeed slower because each time it synchronized the I/O, it had to write this 1M to disk before reading the next 1M, repeating this 128 times. Thus, the speed was very slow, and it hardly utilized the write cache.
Issue 4: What command is more reasonable for us to use in actual testing?
This mainly depends on our testing goals, summarized as:
# Test the most realistic file write speed dd bs=50M count=100 if=/dev/zero of=test conv=fdatasync
# Test cache write speed dd if=/dev/zero of=/sdcard/test bs=1M count=100# (bs count values depend on the actual device Mem situation)
# Skip memory cache dd bs=1M count=128 if=/dev/zero of=test oflag=direct
Knowledge Extension
About Buff/Cache in Memory
Let’s take another look at the output of the free command:
/mnt/sdcard # free -h total used free shared buff/cache availableMem: 958M 259M 475M 2.0M 224M 682MSwap: 255M 0B 255MBy just using the dd command to write files, we can see the changes in buff/cache. However, it is important to distinguish between Buffer and cache, which is not as easy to understand as physical memory Mem and swap Swap.
According to online encyclopedia explanations, Buffer is a buffer area, while cache is a cache. From a literal understanding, it is not easy to distinguish. We can use /proc/meminfo to break it down.
/mnt/sdcard # cat /proc/meminfoMemTotal: 981744 kBMemFree: 486620 kBMemAvailable: 698236 kBBuffers: 10532 kBCached: 187600 kBSwapCached: 0 kBActive: 166944 kBInactive: 267388 kBActive(anon): 102548 kBInactive(anon): 135700 kBActive(file): 64396 kBInactive(file): 131688 kBUnevictable: 0 kBMlocked: 0 kBSwapTotal: 262140 kBSwapFree: 262140 kBDirty: 65580 kBWriteback: 0 kBAnonPages: 236288 kBMapped: 49336 kBShmem: 2060 kBSlab: 44112 kBSReclaimable: 31368 kBSUnreclaim: 12744 kBKernelStack: 3280 kBPageTables: 1856 kBNFS_Unstable: 0 kBBounce: 0 kBWritebackTmp: 0 kBCommitLimit: 753012 kBCommitted_AS: 805532 kBVmallocTotal: 258867136 kBVmallocUsed: 0 kBVmallocChunk: 0 kBFrom the explanation of man free:
buffers     Memory used by kernel buffers (Buffers in /proc/meminfo)
cache       Memory used by the page cache and slabs (Cached and SReclaimable in /proc/meminfo)
buff/cache      Sum of buffers and cache
So buff/cache in free refers to Buffers + Cached + SReclaimable. The data comes from /proc/meminfo.
Continuing with man proc, we can obtain detailed documentation on the proc filesystem. Translated, it states:
-
Buffers is temporary storage for raw disk blocks, used to cache disk data, usually not particularly large (around 20MB). This allows the kernel to concentrate scattered writes and optimize disk writing uniformly, such as merging multiple small writes into a single large write, etc.
-
Cached is the page cache for files read from disk, used to cache data read from files. Thus, when accessing these file data next time, it can be quickly retrieved from memory without needing to access the slow disk again.
-
SReclaimable is part of the Slab. Slab consists of two parts, with the reclaimable part recorded by SReclaimable; while the unreclaimable part is recorded by SUnreclaim.
Testing
Clearing System Cache
/ # free -h total used free shared buff/cache availableMem: 958M 259M 475M 2.0M 224M 682MSwap: 255M 0B 255M/ # echo 3 > /proc/sys/vm/drop_caches/ # free -h total used free shared buff/cache availableMem: 958M 259M 635M 2.0M 64M 681MSwap: 255M 0B 255M/ #Execute dd if=/dev/zero of=./test bs=1M count=500 Observe the changes in memory and I/O
/mnt/sdcard # vmstat 1procs -----------memory---------- ---swap-- -----io---- -system-- ------cpu----- r b swpd free buff cache si so bi bo in cs us sy id wa st 1 0 0 650608 948 64324 0 0 3 284 216 248 5 21 71 3 0 1 0 0 650444 948 64460 0 0 0 0 1581 2006 5 20 75 0 0 2 0 0 650640 948 64460 0 0 0 0 1518 1958 5 20 74 0 0 1 0 0 650428 948 64460 0 0 0 0 1542 1997 5 21 74 0 0 2 0 0 624732 1716 85624 0 0 1873 12 7329 7395 6 32 58 4 0 2 0 0 566844 1772 145052 0 0 10 12606 8838 6537 7 51 43 0 0 1 1 0 558848 1780 153820 0 0 2 0 3158 2955 5 25 51 19 0 2 0 0 554000 1780 158068 0 0 4 4154 2968 3202 5 23 55 17 0 3 0 0 508076 1876 203236 0 0 6 37030 15177 13524 6 43 45 5 0 2 0 0 470896 1932 241664 0 0 6 66952 9652 8827 5 37 46 11 0 1 1 0 -
Both Buffer and Cache are increasing, but it is evident that Cache is increasing much faster. This indicates that data is being cached in Cache during file writing.
-
The results of multiple I/O writes add up to the 500MB of data that dd needs to write. Only after this is completed do we obtain the actual write speed we wish to test.
The greater advantage of Cached will be reflected in iozone rewrite tests.
Summary of iozone Experience and Reflections on Issues
About iozone
iozone is a benchmark tool for file systems that can test the read and write performance of file systems under different operating systems. It can test various modes such as Read, write, re-read, re-write, read backwards, read strided, fread, fwrite, random read, pread, mmap, aio_read, aio_write, etc. When testing, please ensure that the size of the test file is larger than your memory (ideally twice the size of memory), otherwise Linux will cache the read and write content, resulting in very unrealistic values. (Excerpt from encyclopedia)
There are too many explanations online for the installation and use of iozone, so I won’t take up too much space here and will go straight to the point.
Common Testing Commands
# Write Speed
./iozone -i0 -Rab ./test-iozone-write.xls -g 2G -n 1M -w -e -C
# Read Speed
./iozone -i1 -Rab ./test-iozone-write.xls -g 1G -n 1M -w -e -C
Testing Script
Because of the large number of tests, it is generally recommended to organize a testing script for convenience in executing a large number of testing tasks.
clear echo "a. automatic mode" echo "b. write/rewrite " echo "c. read/re-read" echo "d. random-read/write" echo "e. fwrite" echo "f. fread" echo "please input (a-e) to select function" read letter case $letter in "a") iozone -Rab /tmp/test-iozone-auto.xls -g 2G -n 1M -w -e -C ;; "b") iozone -i0 -Rab /tmp/test-iozone-write.xls -g 2G -n 1M -w -e -C ;; "c") perf_proc/iozone -i1 -Rab /tmp/test-iozone-read.xls -g 2G -n 1M -w -e -C ;; "d") perf_proc/iozone -i2 -Rab /tmp/test-iozone-random-rw.xls -g 2G -n 1M -w -e -C ;; "e") perf_proc/iozone -i3 -Rab /tmp/test-iozone-fwrite.xls -g 2G -n 1M -w -e -C ;; "f") perf_proc/iozone -i4 -Rab /tmp/test-iozone-fread.xls -g 2G -n 1M -w -e -C ;; *) ;; esac ;;Testing Analysis
Here is a write report from an automated test result, with columns (file size KB) and rows (reclen KB)
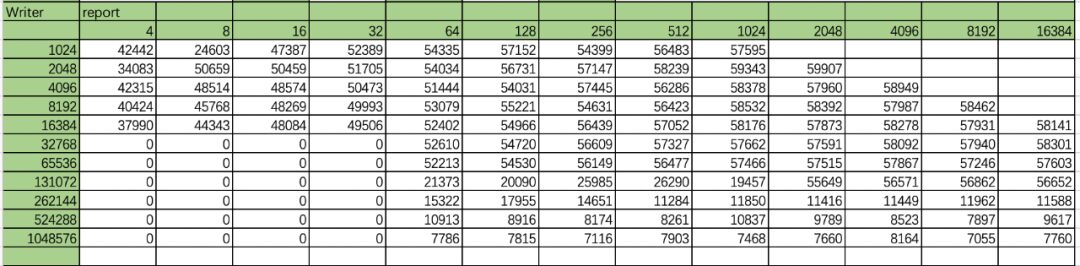
Table: Device Writer Test Records
Issue 1: In actual testing, with a larger test range and data volume, how can we better analyze?
To intuitively feel the trend, we can draw a surface plot. Simple analysis can be done directly using Excel’s charting function by selecting a surface chart. Other tools like gnuplot can also be used. The author here uses Excel’s charting function.
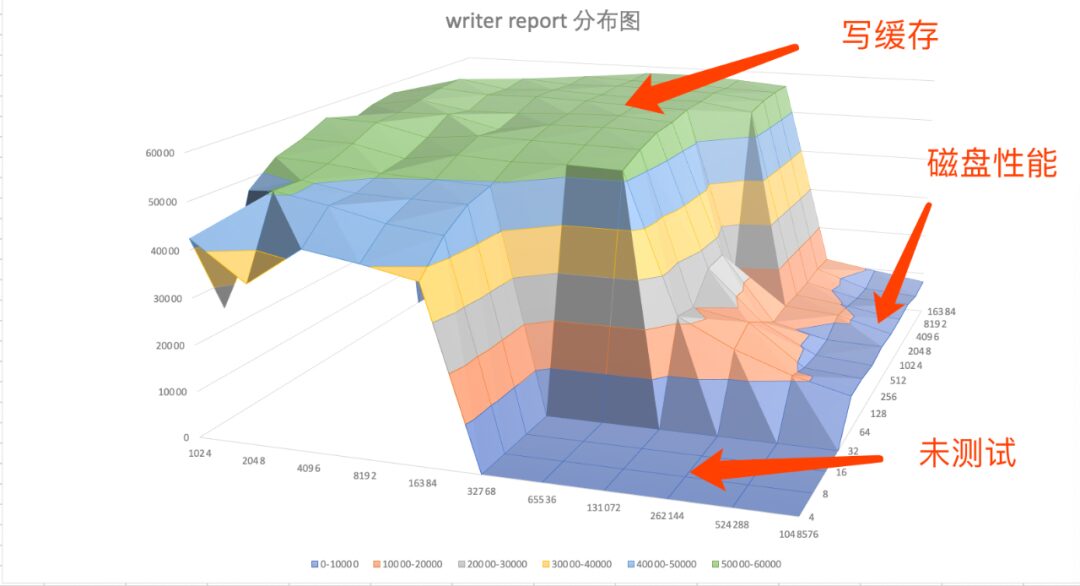
Figure: Device Re-writer Test Records Surface Plot
When the file is smaller than 262M, the actual test is the process of reading from disk into memory, which is the write cache process, equivalent to the above:
dd if=/dev/zero of=/sdcard/test bs=1M count=100When the file is larger than 524M, the actual test results are close to the real disk IO performance.
Next, let’s look at the re-writer’s test records:
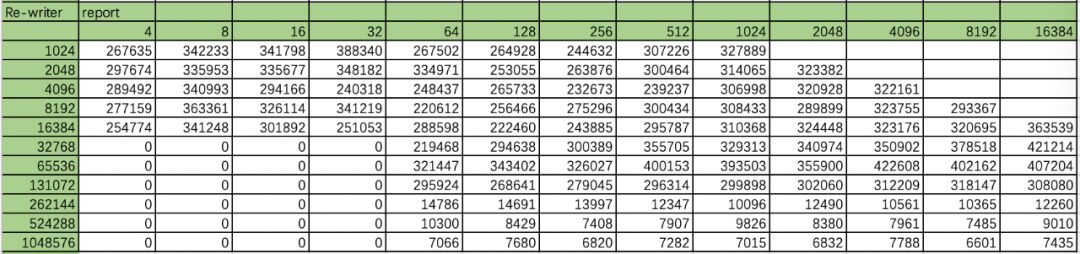
Table: Device Re-writer Test Records
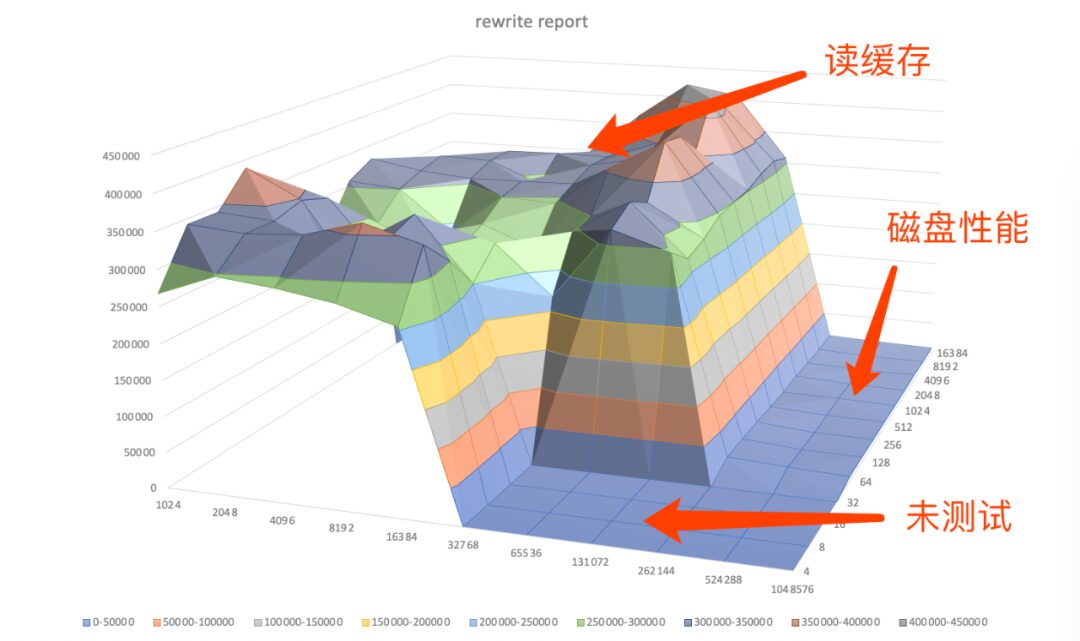
Figure: Device Re-writer Test Records Surface Plot
Speed differences are more evident in rewrites. When the file is smaller than 262M, it directly reads from the cache, achieving peak speed. When it is 524M or larger, the write and rewrite speeds show almost no difference.
Issue 2: In actual testing, with so many values, which value should we focus on?
Answer: All of them are important. In tests involving replacing eMCP, both performance values should be considered. If replacing eMMC, the focus is generally on disk IO performance (specifics depend on the test summary).
Testing Summary:
In tests involving the replacement of eMCP, after completing IO, Mem stress tests and performance tests, we ultimately need to return to functionality. In cases where functionality tests are all OK, we should compare performance in real functional scenarios, such as:
-
OTA upgrade speed;
-
Flashing speed;
-
Factory reset speed;
-
Performance of other core device functions;
In actual testing, there have been instances where the disk performance of Material A was better than that of Material B, but the OTA upgrade speed was significantly lower than that of Material B. Therefore, comparative testing needs to be evaluated and analyzed from multiple dimensions.
Finally, attached is hardcore performance testing material, a 50-page case study on performance bottlenecks.
Content includes:
1. Performance Analysis Steps
2. Performance Analysis Commands
3. Common Performance Issues Summary
4. Bottleneck Analysis Summary and Cases
A total of 50 pages of material, this resource is sufficient for understanding knowledge about performance bottlenecks!

👇 How to obtain 👇
Scan to enter the resource group
Reply “Performance Bottleneck”

Currently, over 100,000 people have followed and joined us


