Teaching Objectives
In the process of embedded software development, soft debugging is a key technical means for locating and fixing program defects. Soft debugging refers to systematic debugging of software logic using simulation tools without physical hardware or development boards. The main debugging methods include:
① Step Execution: Trace the program flow instruction by instruction to accurately locate exceptions;
② Register Monitoring: Real-time observation of CPU register status and value changes;
③ Memory Analysis: Check the data read and write status in specified memory areas;
④ Variable Tracking: Dynamically monitor the real-time values and scope changes of program variables.
Readers can master the above soft debugging methods in Keil5 through this course.
1.Setting Up the Debugging Environment
To maintain teaching continuity, this course directly reuses the existing Keil5 project file from “The First LED Experiment.” This project already includes basic hardware drivers and GPIO configurations, allowing for quick verification of debugging functions.
1.1.Step 1: Configure Debugging Mode
① Open the Keil5 project and select “Target1” in the project management window, as shown in the figure below:
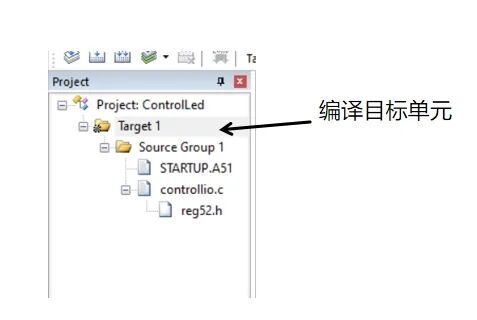
TargetX represents a complete compilation target unit, containing all compilation configurations (such as compiler options, memory allocation, etc.) for a specific chip model. Target1 is automatically generated when creating a new project and is defaulted to the selected chip’s development environment. A single project can contain multiple Targets (such as Target1, Target2) for managing different hardware platforms or code versions with different compilation configurations.
Currently configuring the debugging mode for Target1.
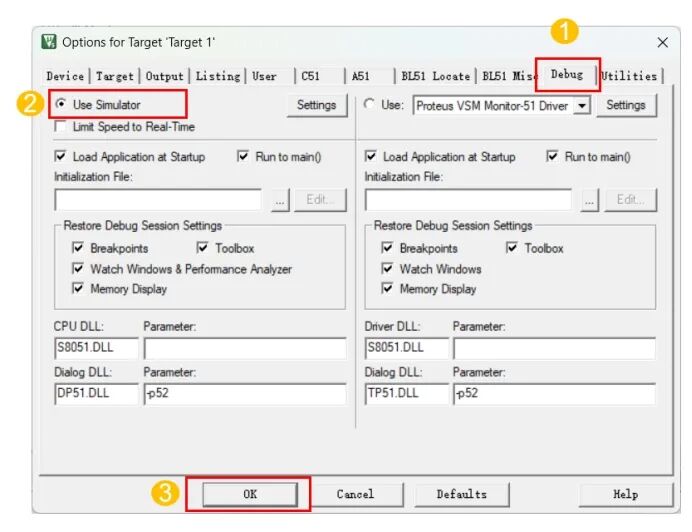
② Expand the “Project” menu and select the “Options for Targets 1…” command. In the pop-up dialog, select the “Debug” tab and ensure that “Use Simulator” is checked.
1.2 Step 2: Disable Compiler Optimization
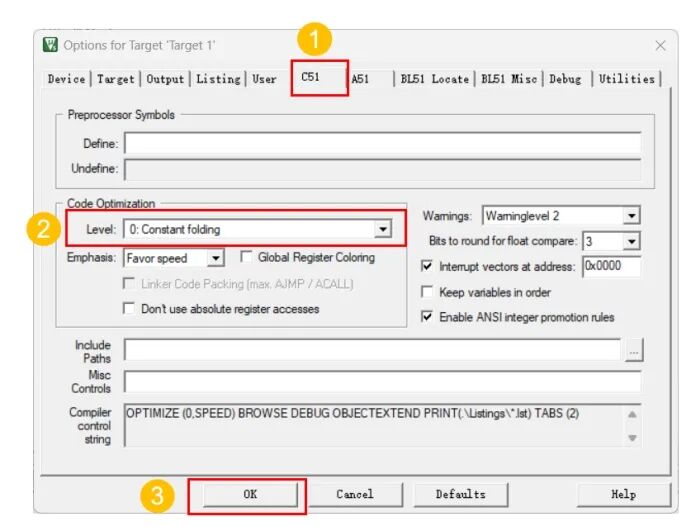
Before debugging, disable compiler optimization (set optimization level to 0) to avoid breakpoint failures. The steps to disable are as follows:
2. Debugging Methods
Before entering the debugging phase, it is necessary to enhance the debugging code in the main() function of the controllio.c file by inserting valuable code segments to support step debugging analysis. The modified code is as follows:
#include <reg51.h>
bit led1 = P1^0;
void delay_ms(unsigned int ms) {
    unsigned int i, j;
    for(i=0; i<ms; code="" delay_ms(1);="" for(j="0;" i++)="" j++);="" j<1;="" led1="1;" main()="" void="" while(1)="" {="" }="" }<=""></ms;></reg51.h>
Note: After modifying the code, it needs to be recompiled successfully.
2.1 Step 1: Set Breakpoints
A breakpoint is a marker set on a line of code, which can be set on any line of code. When the program execution reaches a line of code marked with a breakpoint, the program will pause execution, allowing developers to view memory, variables, call stacks, and other information to locate and fix errors.
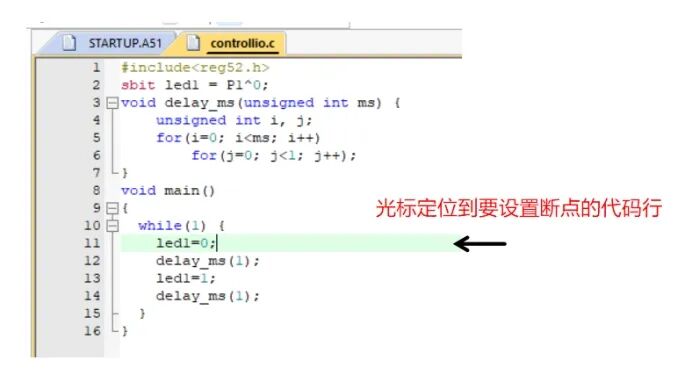
① In the code editing window, position the cursor on the line of code where you want to set a breakpoint, as shown in the figure below:
② Expand the “Debug” menu and select the “Insert/Remove Breakpoint” command, or double-click the gray area to the left of the statement to set a breakpoint, as shown in the figure below:
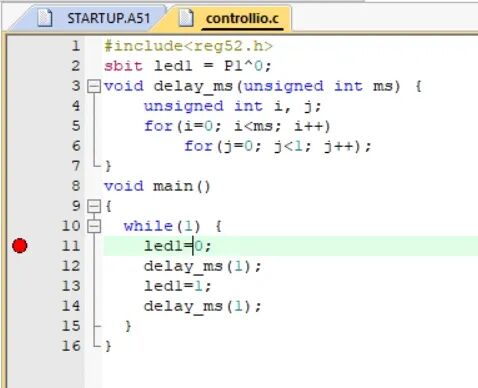
The line with the breakpoint will display a red circle, indicating that a breakpoint has been set on that line of code. Developers can set multiple breakpoints on different lines, and when the program execution reaches a breakpoint, it will pause, allowing developers to view the current status and values of various registers, variables, and data read/write status in memory.
2.2.Step 2: Execute Debugging
After setting the breakpoints, execute the program for debugging.
① Execute the program: Expand the “Debug” menu, select the “Start/Stop Debug Session” command, or press Ctrl+F5, or click the start debugging icon on the toolbar to start the program’s simulation debugging. The interface after starting debugging is shown in the figure below:
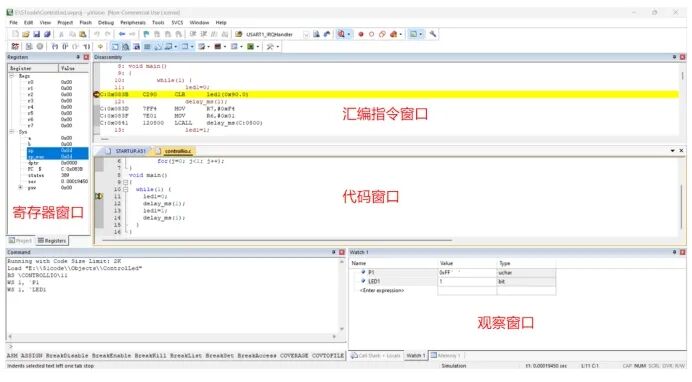
Register Window: View the status and values of various registers in the microcontroller.
Assembly Instruction Window: View the assembly instructions corresponding to the C source code and their memory addresses.
Code Window: View the content of the C source code file, with a yellow arrow indicating the current execution position, and a blue arrow (blue triangle) indicating the line where the cursor is currently located or the currently selected line of code.
Watch Window: Used for real-time monitoring of variable value changes.
② Watch Window: Keil5 provides two independent watch windows, Watch1 and Watch2. Expand the “View” menu, select the “Watch Windows” command, and from the drop-down menu, choose “Watch1” or “Watch2”. Keil will add “Watch1” or “Watch2” to the watch window. The figure below shows “Watch1” or “Watch2” added to the watch window:
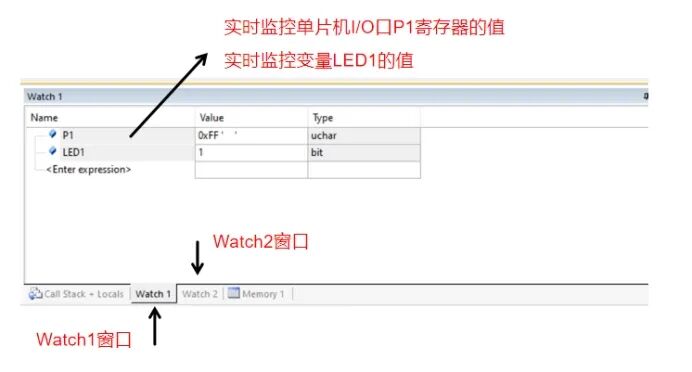
The above Watch1 window can monitor the value of the microcontroller’s I/O port P1 register and the program variable LED1 in real-time.
Methods to add observed variables in the Watch window:
Method 1: Double-click the area in the watch window and directly input the variable name (register name, program variable name);
Method 2: Right-click on the variable in the code → select Add ‘variable name’ to Watch;
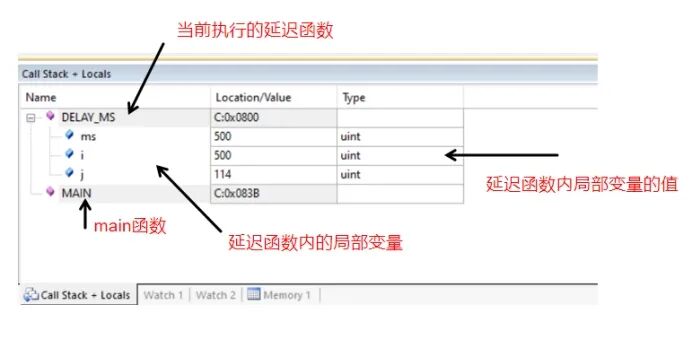
③ Call Stack + Locals Window: Mainly used to analyze function call relationships and local variable states, with specific observation contents as follows:
(1) Automatically lists all local variables within the currently executing function and their real-time values;
(2) Displays the current function and its call chain, with the bottom being the earliest called function (e.g., main()), and the top being the currently called function.
④ Memory Window: Keil5 provides four independent memory observation windows. Expand the “View” menu, select the “Memory Windows” command, and from the drop-down menu, choose “Memory X” to add “Memory X” to the watch window. The figure below shows “Memory 1” added to the watch window:
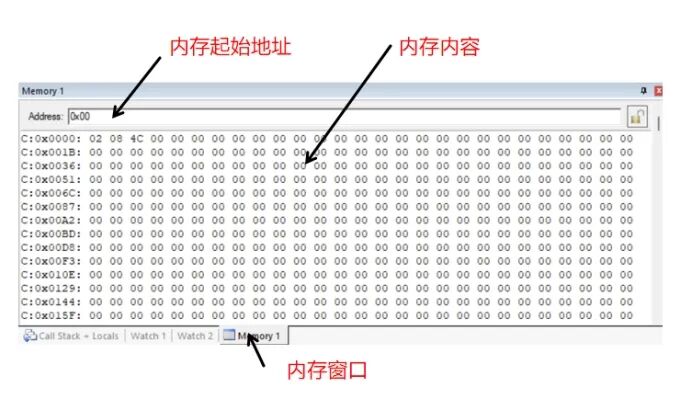
The memory window can view data from different storage areas by entering the starting address of the storage area in the Address input field.
⑤ View Microcontroller I/O Ports: The 51 microcontroller generally has four groups of 8-bit I/O ports, corresponding to the microcontroller’s P0~P3 registers. P1~P4 registers are 8-bit registers. During program debugging, you can view the status and values of P0~P3 registers in real-time and observe the program’s impact on P0~P3 registers. Expand the “peripherals” menu, select the “I/O-Ports” menu item, and then in the pop-up submenu, select “Port X(0~3)”.
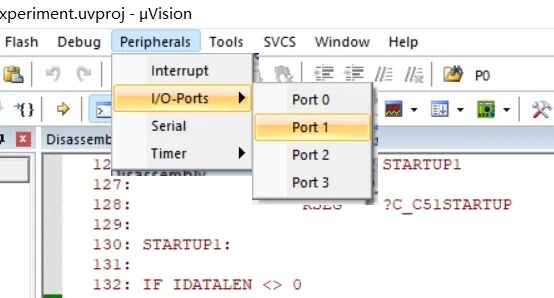
Keil pops up the P1 port status dialog box, as shown in the figure below.
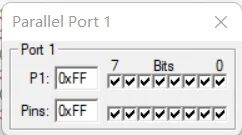
From the figure, it can be seen that the current logical states of P1 port bits 0~7 are all 1. Continue executing the program and check the P1 port status again.
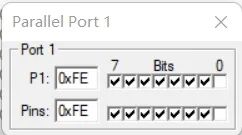
The logical state of bit 0 of the P1 port has changed, and its logical state is now 0.
2.3. Step 3: Step Execution
Step execution means executing only one line of code at a time and pausing the program after execution, allowing developers to observe the current register, variable values, memory status, and other intermediate results. This is used to troubleshoot existing issues in the program or verify the execution results of the program.
Before step execution, position the cursor in the code editing window, then press F10 or select the “Debug” menu under “Step Over” command, which will allow Keil5 to execute the code on the current breakpoint and point the yellow arrow to the next line of code to be executed, as shown in the figure below:
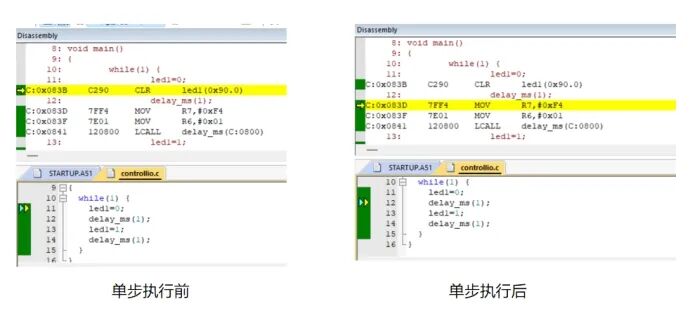
If the current statement being executed is a function call, how should it be handled?
In this case, there are two options: one option is to skip the function without entering its internal code; the other option is to enter the function and execute its internal code line by line.
The first option: Press F10 or select the “Debug” menu under “Step Over” command, and Keil5 will execute the function without entering its internal code;
The second option: Press F11 or select the “Debug” menu under “Step” command, and Keil5 will enter the function, allowing developers to execute the internal code line by line. You can also press Ctrl+F11 or select the “Debug” menu under “Step Out” command to exit the function.
During step execution, if you want the program to execute directly to a certain line of code, you can position the cursor on that line of code and then press Ctrl+F10 or select the “Debug” menu under “Run to Cursor Line” command. Keil5 will execute the program directly to that line of code.
3. Configuring Proteus Simulation Debugging
Keil5 supports simulation debugging with Proteus, allowing the program to be controlled step by step in the Proteus simulator, enabling real-time observation of the simulation circuit’s operational changes. However, there is a drawback in the simulation debugging between Keil5 and Proteus, where it is difficult to observe the real-time changes of registers, variables, etc. In step execution, there may be instances of skipping statements (the statements have been executed correctly).
3.1.Step 1: Download the VDM51.dll File
VDM51.dll is a dynamic link library file mainly used to connect Keil5 and Proteus simulation software in embedded system development, enabling joint debugging functionality between the two.
It is recommended to download from official or trusted DLL file repositories to avoid malware risks. Some technical forums or resource sites may provide this file, but it is necessary to carefully verify the file’s security.
① Copy the downloaded VDM51.dll file to the MODELS folder in the Proteus installation directory.
② Copy the downloaded VDM51.dll file to the C51\BIN directory of Keil.
3.2.Step 2: Modify the Keil Configuration File
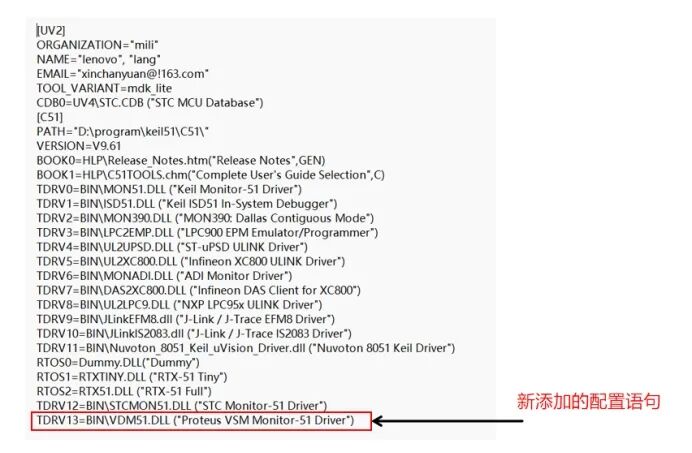
Edit the Tools.ini file in the Keil directory and add the following under the [C51] field:
TDRV9=BIN\VDM51.DLL (“Proteus VSM Monitor-51 Driver”)
Note: The number after TDRV should avoid duplication with existing entries.
3.3.Step 3: Configure Keil5 Debugging Mode
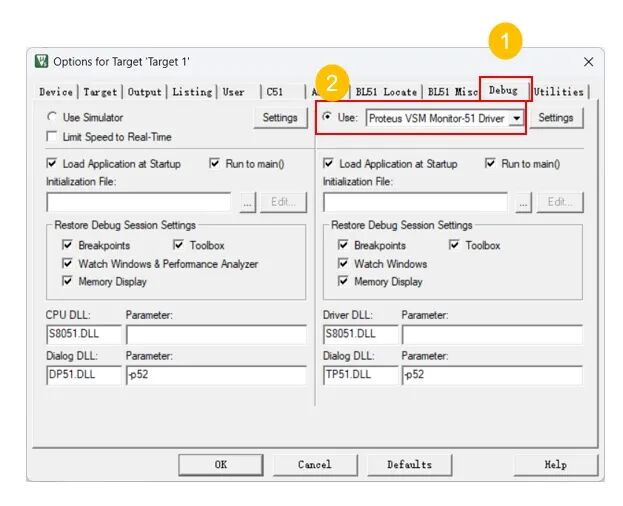
Expand the “Project” menu, select the “Options for Targets 1…” command, and in the pop-up dialog, select the “Debug” tab to ensure that “Proteus VSM Monitor-51 Driver” is selected.
3.4.Step 4: Configure Proteus
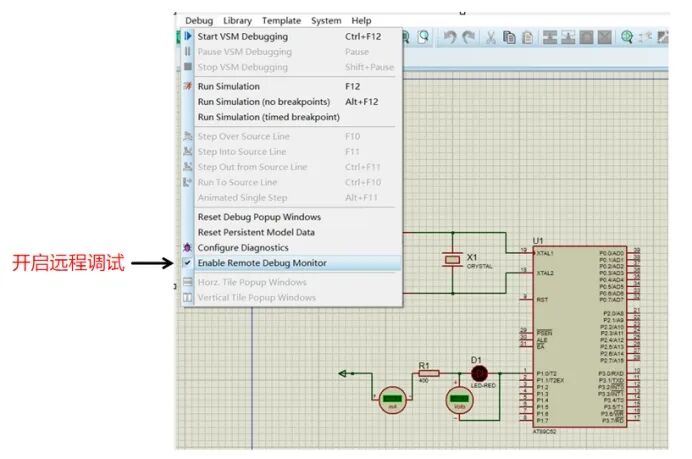
Start Proteus, open the project file, expand the “Debug” menu, and select the “Use Remote Debug Monitor” command to enable remote debugging.
5. Joint Debugging of the Project
4.1.Step 1: Start Joint Debugging on the Proteus Side
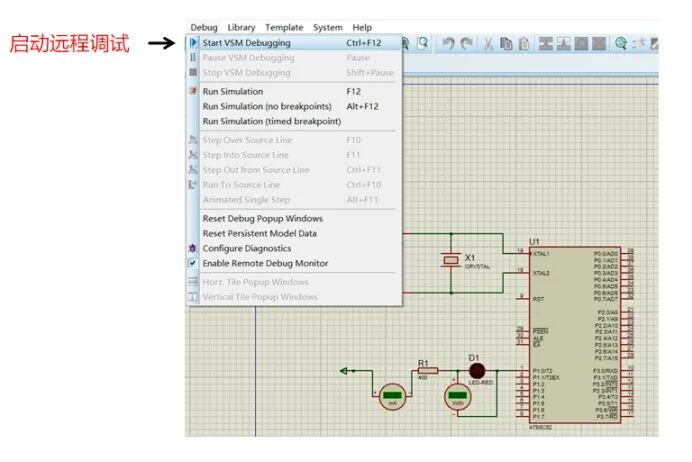
Start Proteus, open the project, press Ctrl+F12 or expand the “Debug” menu, and select the “Start VSM Debugging” command to start remote debugging, as shown in the figure below:
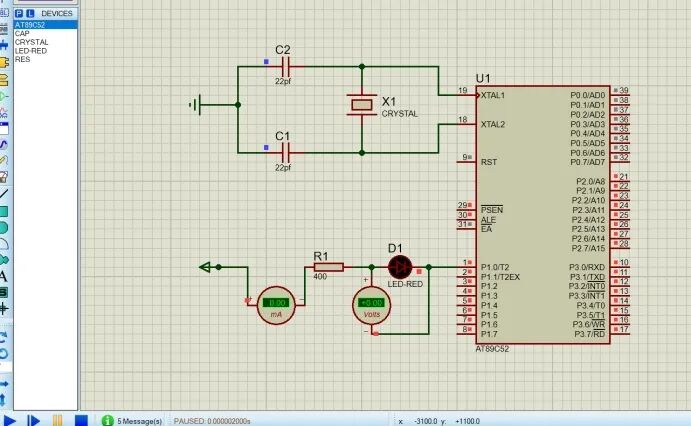
After starting remote debugging, the program is waiting to execute. The figure below shows:
4.2.Step 2: Start Joint Debugging on the Keil Side
Start Keil5, open the project (the program generated by this project is loaded by Proteus), expand the “Debug” menu, select the “Start/Stop Debug Session” command, or press Ctrl+F5, or click the start debugging icon on the toolbar to start the program’s simulation debugging. The interface after starting debugging is shown in the figure below:
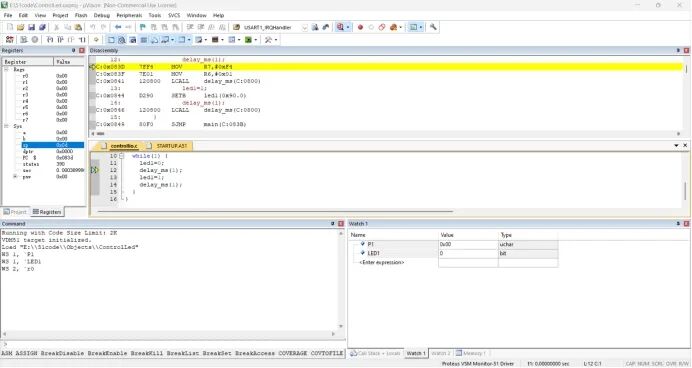
The Command window displays “VDM51 target initialized,” indicating a successful connection.
Note: There may be issues with skipping statements and the real-time changes of registers and variables during joint debugging between Proteus and Keil5.
5. Summary
In this lesson, we learned the soft debugging methods of Keil5. Soft debugging refers to systematic debugging of software logic using simulation tools without physical hardware or development boards.
There are two methods of soft debugging: one method is to use the simulation tools provided by Keil5 for systematic debugging. The advantage of this debugging method is that it allows real-time viewing of registers, variables, and data in memory areas, with fast execution speed and no issues during the debugging process. The disadvantage is that it does not allow for intuitive observation of circuit operation states; the other method is joint debugging between Keil5 and Proteus, which allows for intuitive observation of circuit operation states, but during debugging, there may be issues with skipping statements and the real-time changes of registers and variables.
It is recommended to use the simulation tools provided by Keil5 for debugging program logic issues, and if it is necessary to observe circuit changes during debugging, then use joint debugging between Keil5 and Proteus.
Related Courses:
Quick Start to Microcontroller Development: The First LED Experiment
Quick Start to Microcontroller Development: Microcontroller Principles and Learning Methods