Shear wave elastography (SWE) is a new ultrasound technology developed in recent years, widely used in the diagnosis and differential diagnosis of diseases of the liver, breast, thyroid, prostate, and others[1].
The limitation of SWE lies in the algorithms for assessing tissue elasticity, which neglect the impact of tissue viscosity. Viscosity can also characterize the mechanical properties of tissue structure, representing a different biomechanical characteristic from elasticity. The mechanical properties of biological tissues are important biomarkers for diagnosing various diseases. Ignoring tissue viscosity can lead to errors in elasticity measurements, resulting in the omission of valuable diagnostic information in disease diagnosis.
Shear wave dispersion imaging (SWD), as a new imaging technique used to assess the dispersion characteristics of shear waves, is believed to be related to tissue viscosity, allowing for the quantification of tissue viscosity characteristics, explaining the complexity of shear wave propagation in tissues, and characterizing tissue viscosity[2].
Recently, an article published by Wang Kun from Fudan University Zhongshan Hospital’s Ultrasound Department studied the viscosity characteristics of liver tumors using SWD technology and explored the clinical application value of SWD in the differential diagnosis of benign and malignant liver tumors[3].
1. General Information of Liver Tumor Patients
This study included 103 liver tumor patients, with 35 benign cases, including 16 hemangiomas, 8 angioleiomyolipomas (AML), 7 focal nodular hyperplasia (FNH), and 1 case each of granulomatous inflammation, hepatic hematoma, inflammatory pseudotumor, and Ig4-related disease; 68 malignant cases, including 51 hepatocellular carcinoma (HCC), 2 mixed-type liver cancers, 3 intrahepatic cholangiocarcinomas (ICC), 10 metastatic liver cancers, and 1 case each of sarcomatoid carcinoma and myofibroblastic tumors.
2. Instruments and Methods
Using the Canon Aplio i900 ultrasound diagnostic device, with a PV1-475BX convex array probe, frequency 1~8 MHz. In a fasting state, patients were in a supine or left lateral position, with both hands raised and placed at the head side, breathing calmly, and holding breath if necessary. The probe was positioned perpendicularly to the body surface, with its surface parallel to the liver capsule as much as possible, to find the maximum section showing the tumor, then switched to shear wave imaging mode, setting the region of interest (ROI) to cover the liver tumor as much as possible, displaying the shear wave velocity elasticity map of the lesion. Four images were displayed (Figure 1).
After stabilizing the image, it was frozen, using a circular sampling frame with a diameter of 20 mm (the size of the circular sampling frame was adjusted based on the size of the lesion for tumors with a long diameter <2 cm), placed in a relatively uniform position on the elastic map color and isochronous line to measure the SWD value of the liver tumor, measuring 10 times and taking the average as the research data. The SWD value of the liver tissue surrounding the tumor was measured: the examination steps and principles were the same as before, with the ROI located >2 cm from the tumor, avoiding large blood vessels and bile ducts. The size of the ROI could be adjusted as needed, using a circular sampling frame with a diameter of 20 mm to measure the SWD value of the liver parenchyma, taking the average of 10 measurements as the research data (Figure 2).
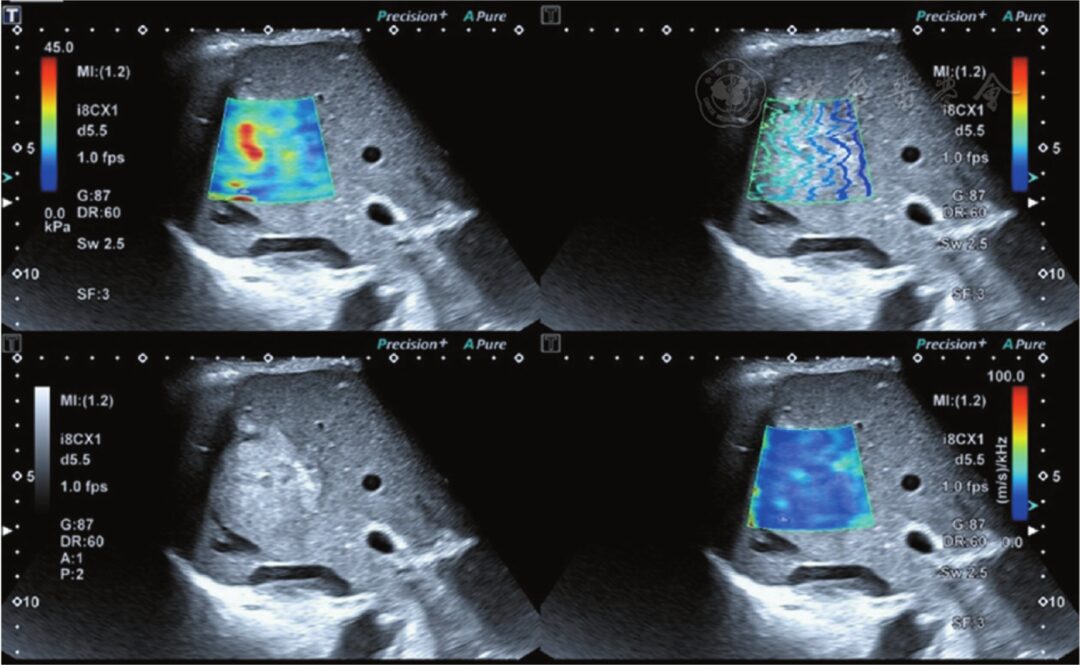
Figure 1 The upper left shows the shear wave elasticity image of the lesion; the lower left shows the two-dimensional grayscale ultrasound image of the lesion; the upper right shows the shear wave propagation image, where the shear wave propagates parallelly, indicating reliable measurement results; the lower right shows the shear wave viscosity image of the lesion
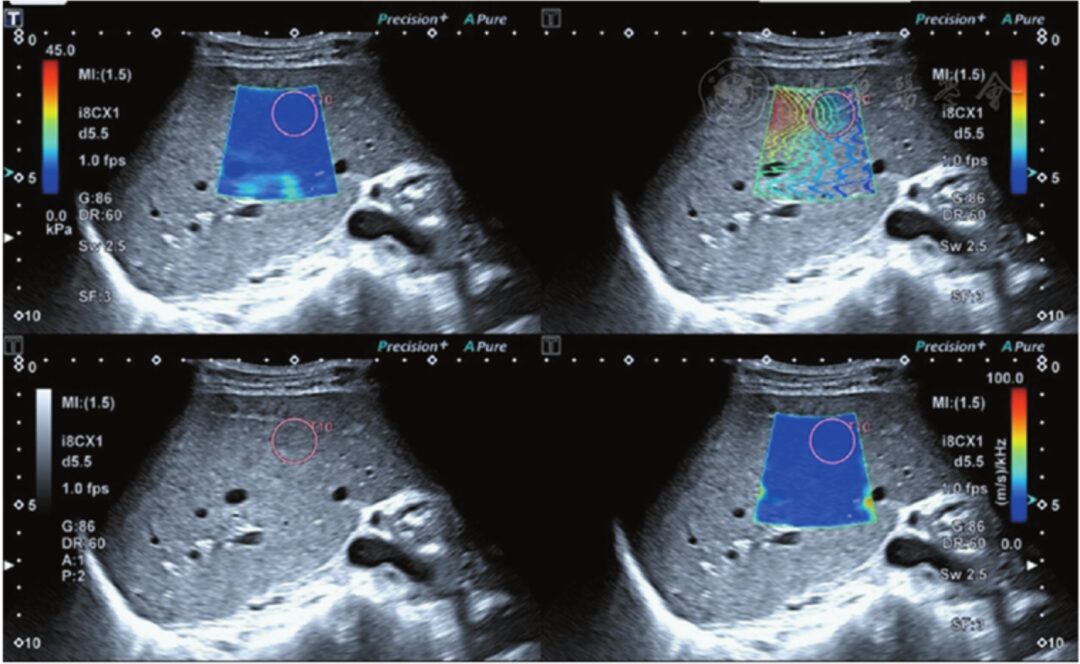
Figure 2 The upper left shows the shear wave elasticity image of liver parenchyma; the lower left shows the two-dimensional grayscale ultrasound image of liver parenchyma; the upper right shows the shear wave propagation image, where the shear wave propagates parallelly, indicating reliable measurement results; the lower right shows the shear wave viscosity image of liver parenchyma
3. Evaluation of SWD Value Stability
During the case collection process, 53 patients were randomly measured by the same examiner at different time points with 2 SWD measurements, evaluating the operator’s internal consistency of liver tumor SWD values. The results showed that the overall observer intraclass correlation coefficient (ICC) for SWD values exhibited good consistency (ICC = 0.834, 95% CI = 0.730~0.901). Additionally, 2 examiners randomly conducted SWD measurements on 50 patients at the same time point, evaluating the inter-observer consistency of liver tumor SWD values. The results showed that the overall observer interclass correlation coefficient (ICC) for SWD values exhibited good consistency (ICC = 0.802, 95% CI = 0.675~0.883).
4. Comparison of SWD Values Between Benign and Malignant Liver Tumors
The malignant group had higher SWD values and liver background SWD values than the benign group, with statistically significant differences (mean P<0.05); the malignant group had lower SWD ratios than the benign group, with statistically significant differences (P<0.05). See Figure 3, Figure 4.
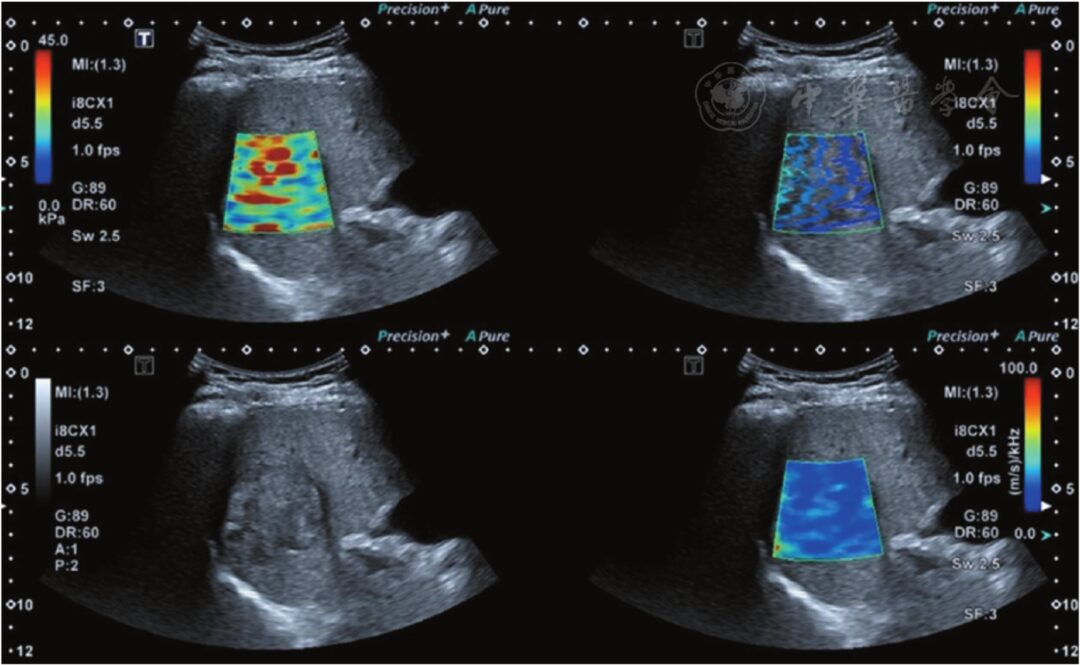
Figure 3 Hepatocellular carcinoma (confirmed by pathology), with a shear wave dispersion imaging (SWD) value of 18.9 m·s-1·kHz-1
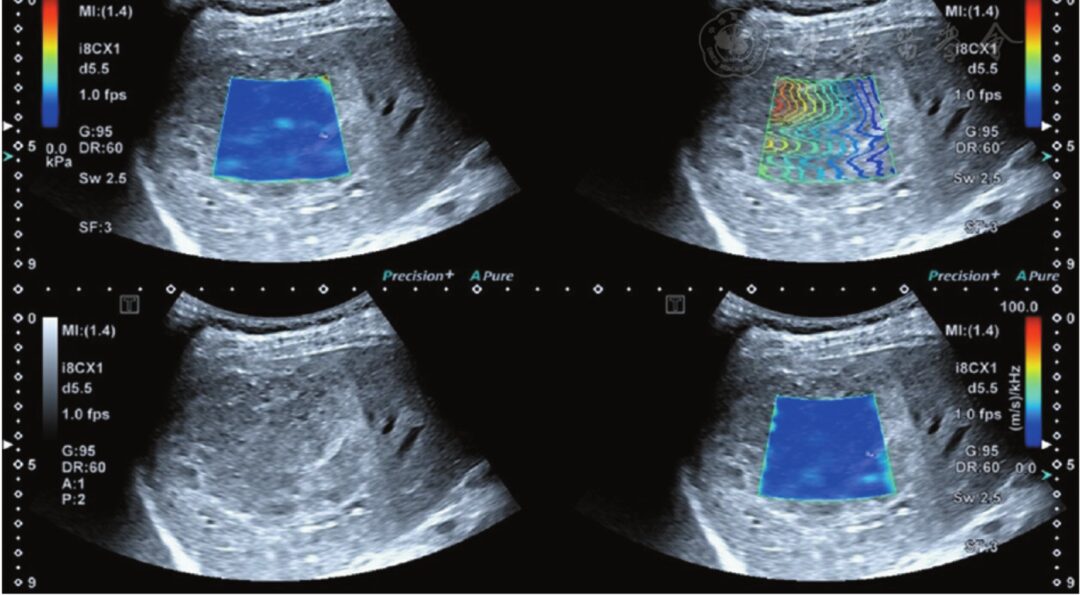
Figure 4 Cavernous hemangioma of the liver (confirmed by pathology), with an SWD value of 15.6 m·s-1·kHz-1
5. Diagnostic Value of SWD Values and Ratios in Differentiating Benign and Malignant Liver Tumors
Using an SWD value >15.60 m·s-1·kHz-1 to diagnose liver malignancy, the area under the curve (AUC) was 0.72, with a sensitivity of 88.2%, specificity of 51.4%, and accuracy of 75.7%; using an SWD ratio <1.32 to diagnose liver malignancy, the AUC was 0.68, with a diagnostic sensitivity of 58.8%, specificity of 74.2%, and accuracy of 63.1%; the combined diagnosis of liver malignancy using SWD values and SWD ratios yielded an AUC of 0.88, with sensitivity of 82.3%, specificity of 83.0%, and accuracy of 81.6%.
6. Mechanisms Behind Abnormal Ultrasound Dispersion Features in Tumors
The measurement of tissue viscosity depends on the pathological components of the examined lesions. The possibility of interpreting mechanical parameters through the internal structure and function of tissues is key to improving the specificity of pathological diagnosis[4]. During tumor formation, cellular structures change under pathological factors, leading to changes in cellular mechanical properties, ultimately resulting in changes in cellular function. Atomic force microscopy can perform mechanical measurements on biological tissues at the microscopic nanoscale, achieving local and overall mechanical studies from single molecules to single cells. Studies suggest that changes in actin within cells can lead to alterations in cell morphology, which can subsequently affect cell elasticity and viscoelasticity. Additionally, collagen in tissue pathology exhibits viscoelastic behavior, attributed to the sliding and cross-linking density of fibers; however, due to its short relaxation time, it seems that the overall response of tissues is dominated by non-collagen components.
In malignant tumors, the cross-linking density of collagen increases, while the reduction of proteoglycans decreases its lubricating effect. Furthermore, malignant liver lesions grow in an environment constrained by surrounding tissues, which may lead to increased interstitial pressure, subsequently causing necrosis in poorly perfused areas within the tumor. Benign liver tumors, such as hemangiomas, consist of numerous congested endothelial cells separated by fibrous septa[5]. In liver tissues and tumors, vascular structures represent the boundaries between different acoustic impedance regions, capable of scattering some sound waves. The differences in biochemical composition observed in malignant lesions, the density of vascular systems, and the heterogeneity of the size distribution of blood vessels within the vascular systems can explain the abnormally elevated ultrasound dispersion features in malignant tumors[6]. Therefore, in liver tumors, the differences in the expression of collagen and proteoglycans, necrosis, pathological inflammation, and tissue composition may lead to different pathological structures between benign and malignant liver tumors, subsequently resulting in differences in viscosity between benign and malignant tumors.
In summary, ultrasound SWD, as a novel imaging method, has high reproducibility, and its measurements are not influenced by lesion size. Compared to conventional ultrasound, this imaging technique provides a new source of tissue contrast, which helps qualitatively and quantitatively analyze lesions when other imaging techniques still have uncertainties, and can supplement valuable diagnostic information such as lesion viscosity, aiding in the differentiation between benign and malignant liver tumors.
References
[1]OzturkA, GrajoJR, DhyaniM, et al. Principles of ultrasound elastography[J]. Abdom Radiol (NY), 2018, 43(4): 773-785.
[2]MartellettiC, ArmandiA, CavigliaGP, et al. Elastography for characterization of focal liver lesions: current evidence and future perspectives[J]. Minerva Gastroenterol (Torino), 2021, 67(2): 196-208.
[3]Wang Kun, Zhu Yuli, Chen Kailin, et al. Preliminary application of shear wave dispersion imaging in differentiating benign and malignant liver tumors[J]. Chinese Journal of Ultrasound Imaging, 2022, 31(6): 518-524.
[4]KimH, LeeJ, KangBJ, et al. What shear wave elastography parameter best differentiates breast cancer and predicts its histologic aggressiveness?[J]. Ultrasonography, 2021, 40(2): 265-273.
[5]DaiWB, XuJ, YuB, et al. Correlation of stiffness of prostate cancer measured by shear wave elastography with grade group: a preliminary study[J]. Ultrasound Med Biol, 2021, 47(2): 288-295.
[6]LuG, LiR, QianX, et al. Layer-specific ultrasound elastography using a multi-layered shear wave dispersion model for assessing the viscoelastic properties[J]. Phys Med Biol, 2021, 66(3): 035003.