 Correlation analysis is one of the main methods for troubleshooting in industry. The conventional analysis process involves: data acquisition -> exporting data -> data preprocessing -> finding data analysis software, importing data -> performing analysis. For PLC-Recorder, this process is greatly simplified: data collection -> open data file -> select curve -> determine analysis period using the ruler -> obtain analysis results. The software automatically performs data alignment and other preprocessing.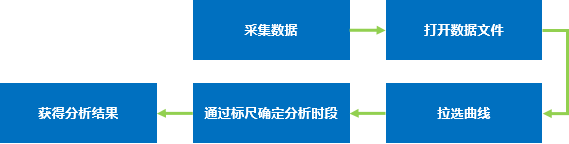

1. Continuous recording of concerned data using PLC-Recorder
Various PLCs have their own addressing rules and collection methods; please refer to the relevant sections of the software manual.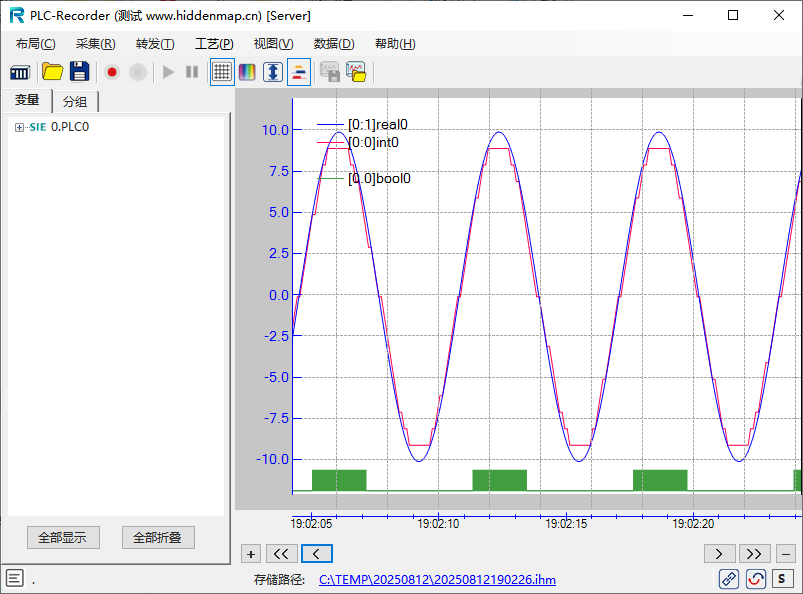
2. Open the recorded data file using Ana analysis software
You can open the data file through the software or by double-clicking the file, then drag the data you need to analyze to the right area to display the curve: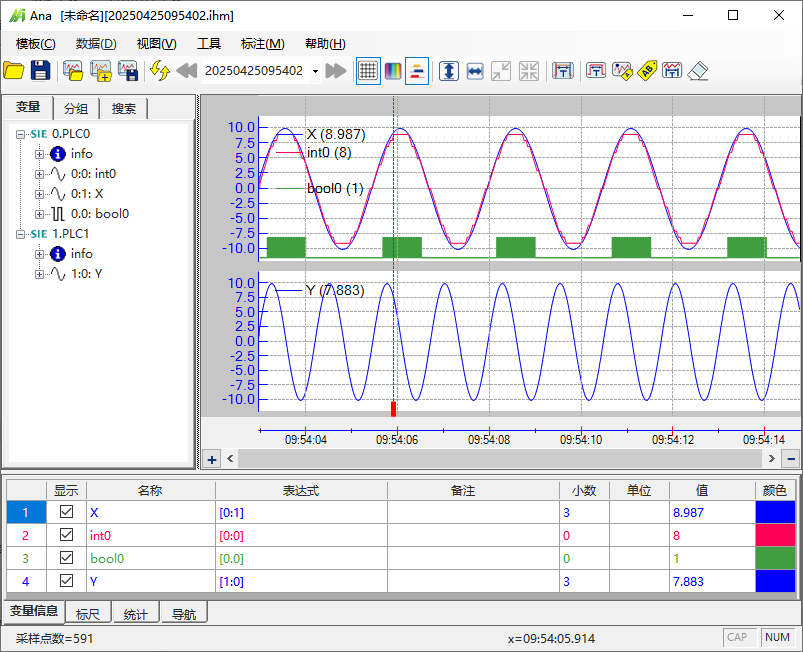 Switch the bottom table to the “Ruler” or “Statistics” tab, and a double ruler will appear, then select the time period you need to analyze.
3. Analysis
Through the menu “Tools” – “Correlation Analysis”, open the analysis interface, select variables, and then click “Recalculate” to obtain the analysis results: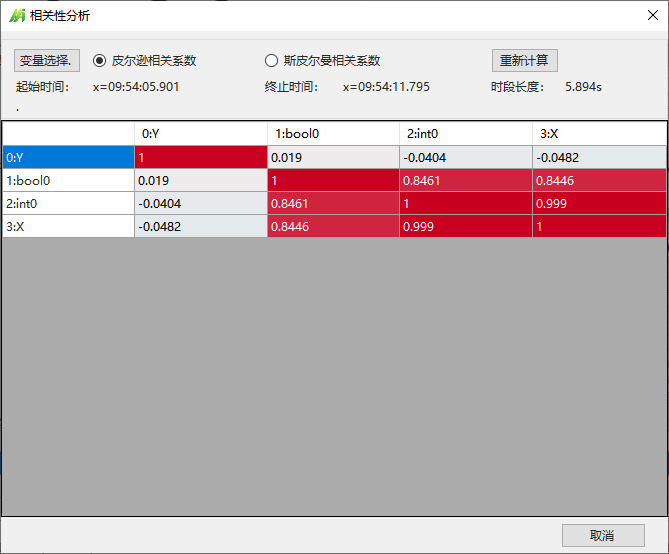 You can adjust the analysis period or variables at any time, then “Recalculate” to get the results.Ana software also has many other analysis functions; feel free to explore and use.

 Extended Knowledge: PLC-Recorder is a professional data acquisition and analysis software that can collect string variables as easily as numerical variables.
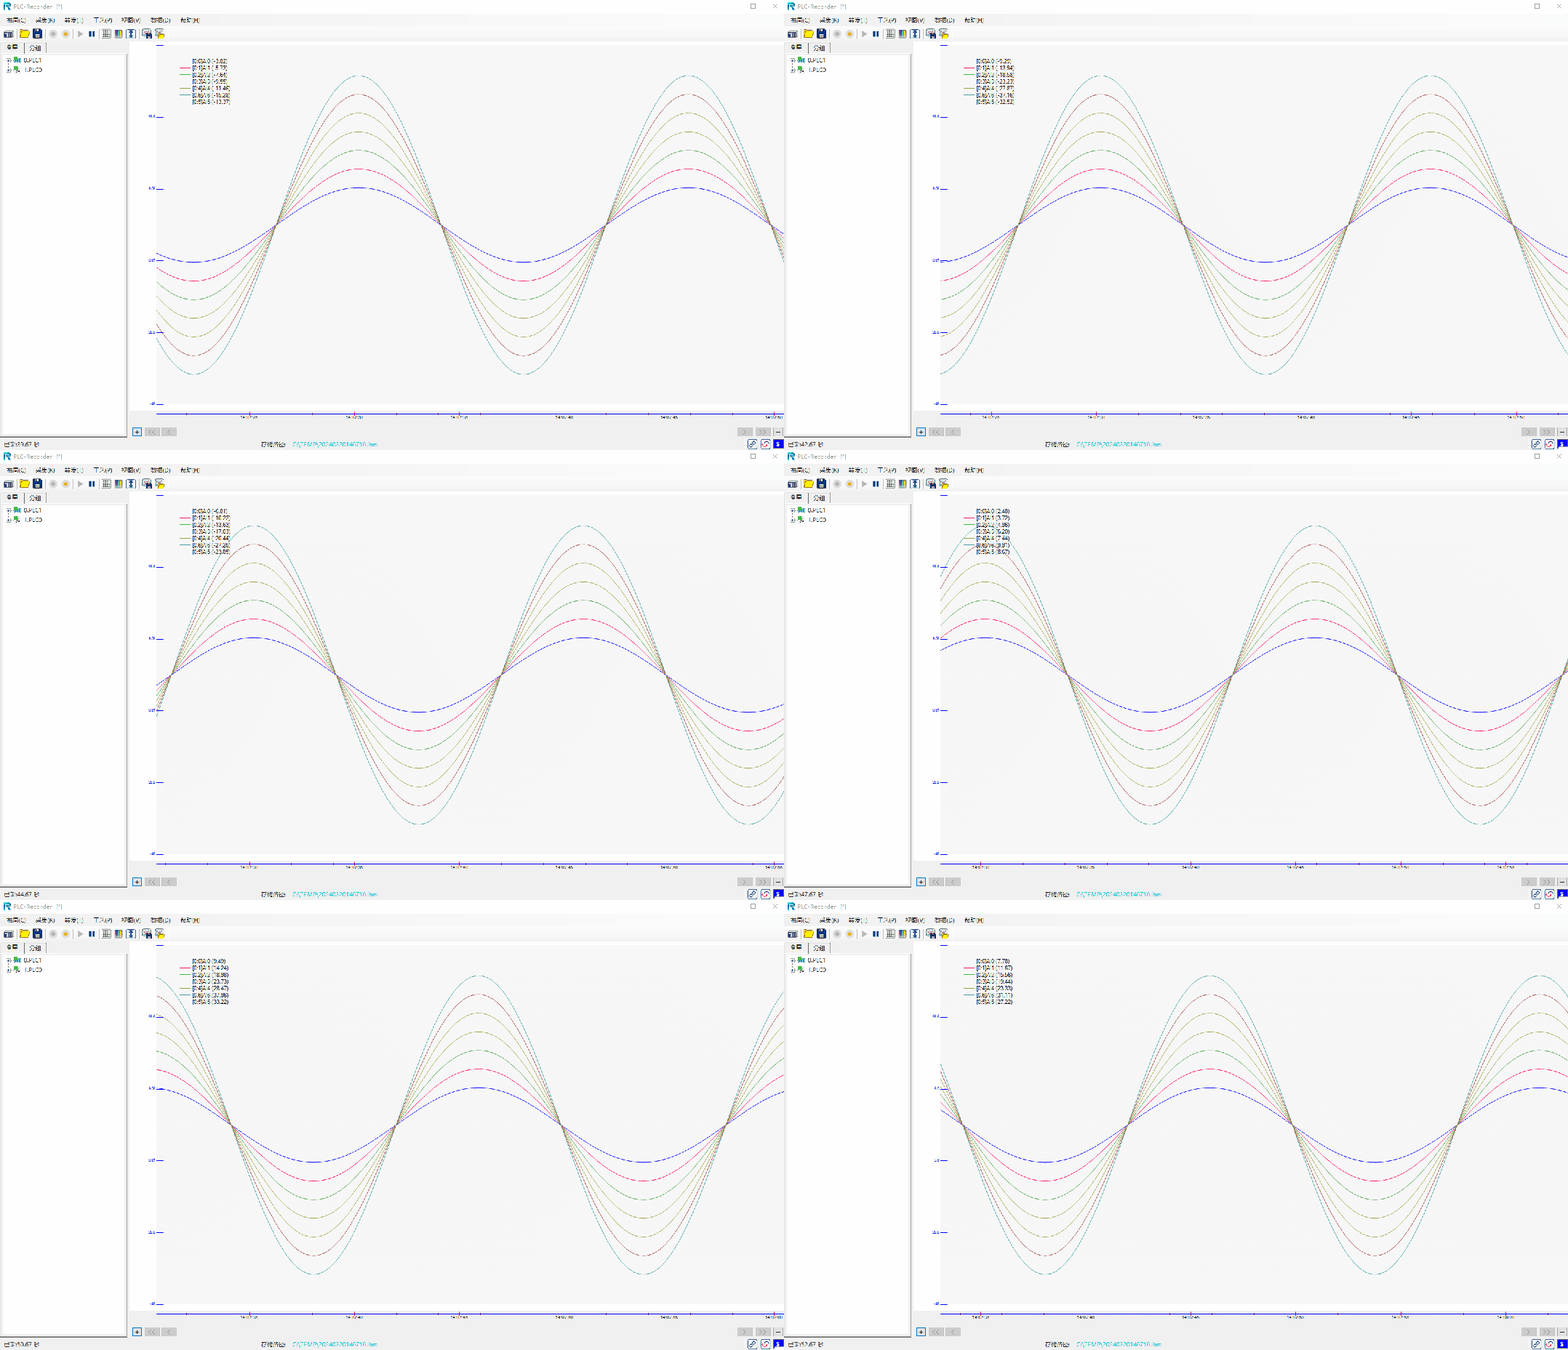 In the future, we will periodically provide more PLC engineering tips. Follow us to stay updated.