Introduction
Modal analysis serves as the foundation for linear dynamic analysis, and the accuracy of its results determines the precision of subsequent transient dynamic calculations. On the other hand, conducting modal analysis of a system helps to understand its overall dynamic characteristics and guides structural dynamics modifications and re-analysis. This case study utilizes foreign commercial software and OptFuture to perform modal analysis of circuit board assemblies, verifying the accuracy of OptFuture in modal calculations for assemblies.
Model Definition2.1 Geometric Definition
As shown in Figure 1, the circuit board assembly consists of a processor (CPU), a graphics chip (GPU), memory chips, capacitors, and connectors. The CPU and GPU are equipped with large passive cooling heat sinks, while the memory chips are located next to the CPU unit. Several cylindrical capacitors of varying sizes are distributed across the motherboard, and multiple connectors for peripheral devices are located at the edges of the motherboard, which is connected to the casing by six mounting bolts.
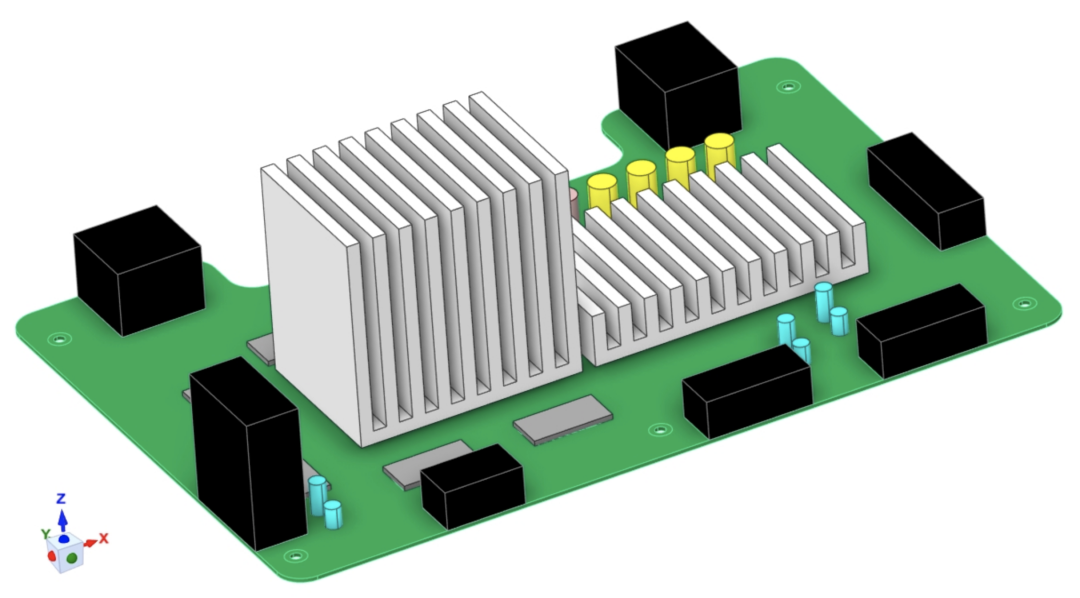
Figure 1 Circuit Board Model
2.2 Material Definition
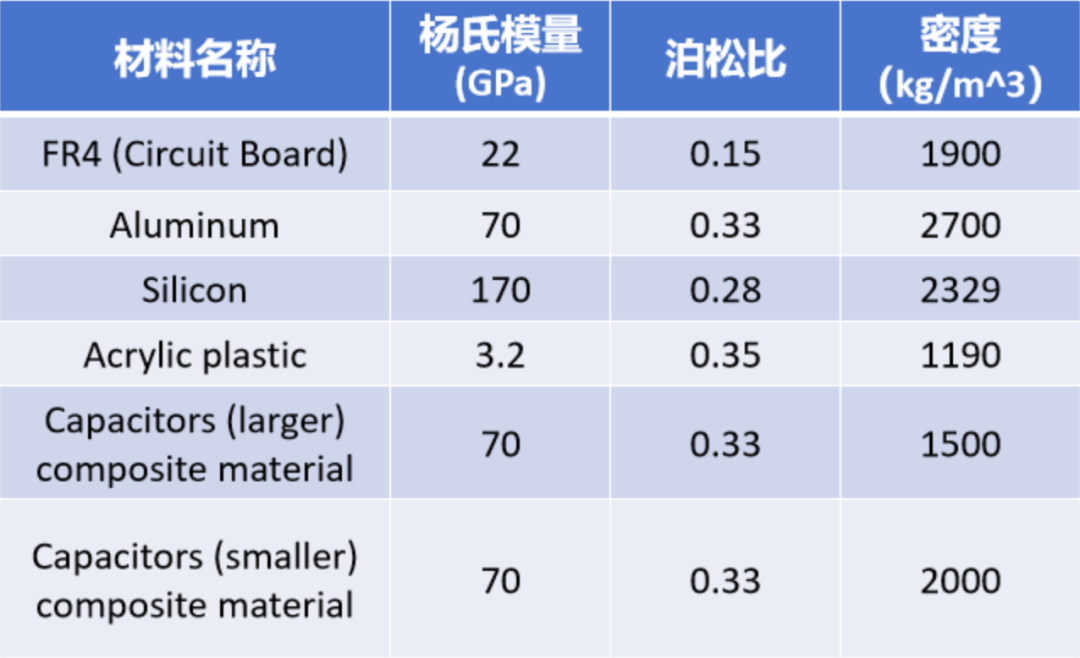
The motherboard itself is made of standard PCB material, the heat sinks are made of aluminum, the chips are made of silicon, the connectors are rectangular and made of plastic, and the capacitors use equivalent materials with similar properties. The material properties of each component are shown in Table 1.
Table 1 Material Properties of Each Component
 2.3 Constraints and Connections
The six mounting holes on the motherboard are defined as fixed constraints on their cylindrical boundaries, and all contact points between components and the motherboard are defined as bonded constraints.
Results3.1 Characteristic Frequencies and Mode Shapes
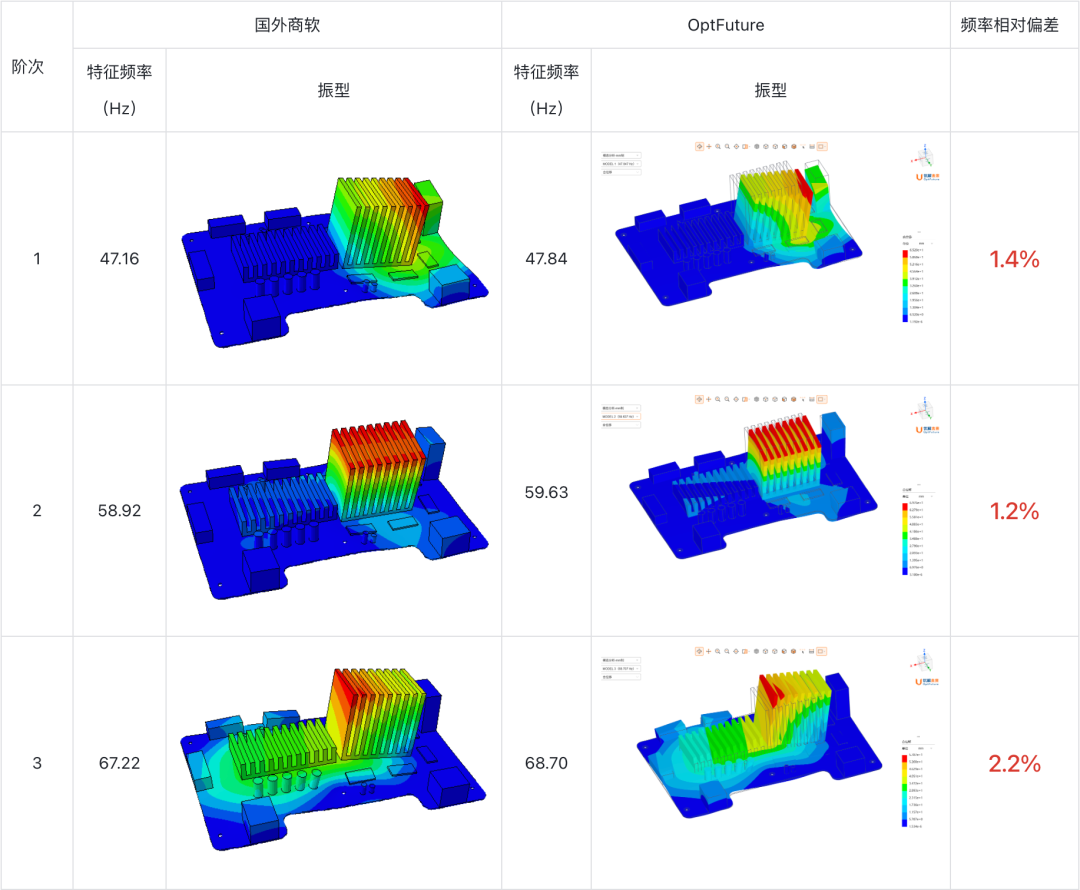
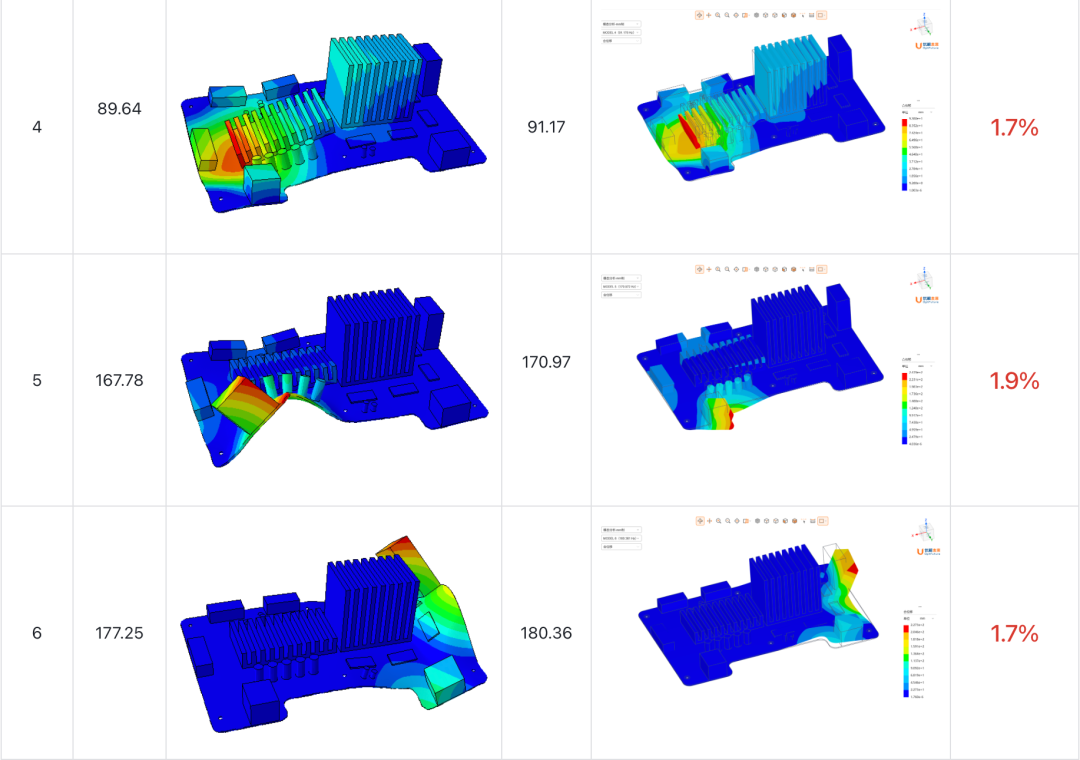
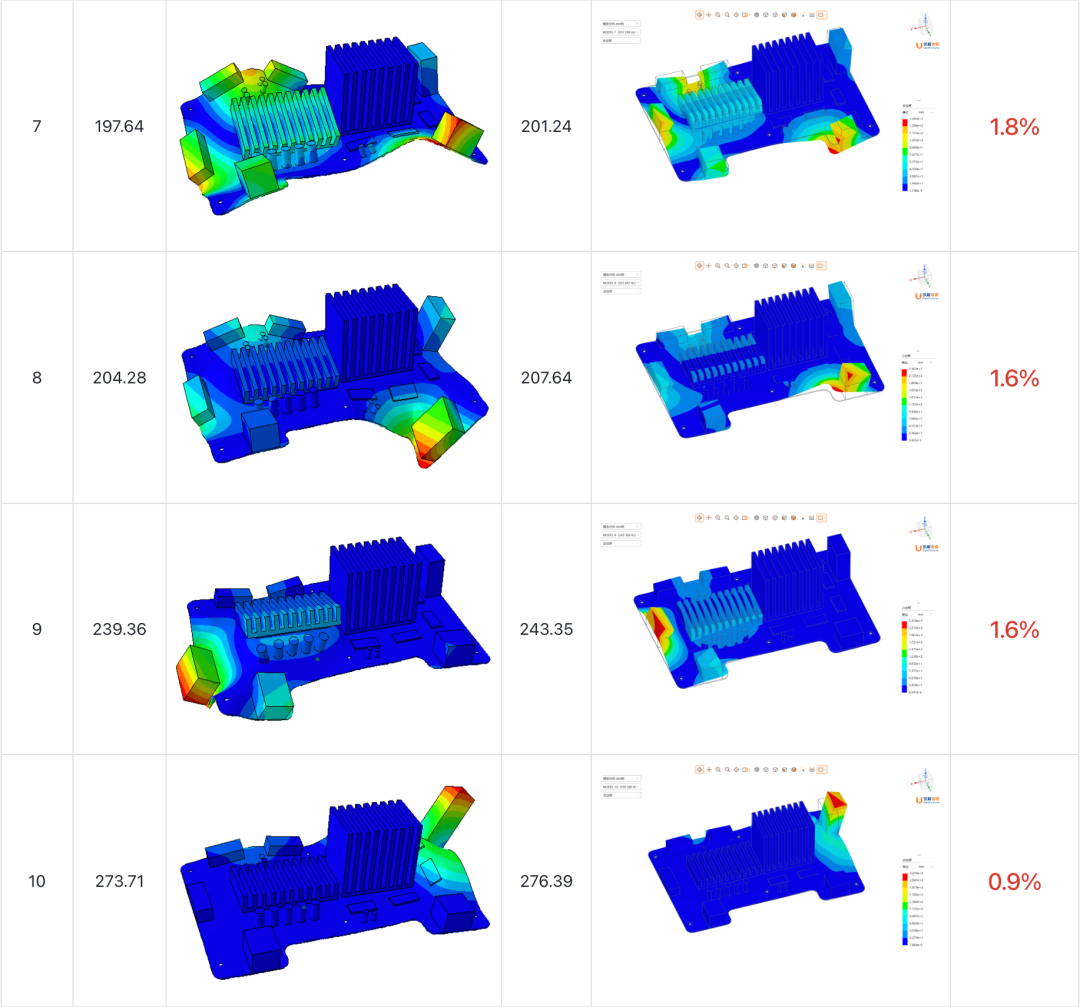
Table 2 presents the first ten characteristic frequencies and corresponding mode shapes of the circuit board calculated using foreign commercial software and OptFuture. The results indicate that the frequencies and mode shapes calculated by OptFuture are generally consistent with those obtained from foreign commercial software. The maximum relative deviation of the first ten frequencies is 2.2%, while the minimum relative deviation is 0.9%.
Table 2 Characteristic Frequencies and Mode Shapes of the Circuit Board Calculated by OptFuture
 3.2 Effective Mass Comparison
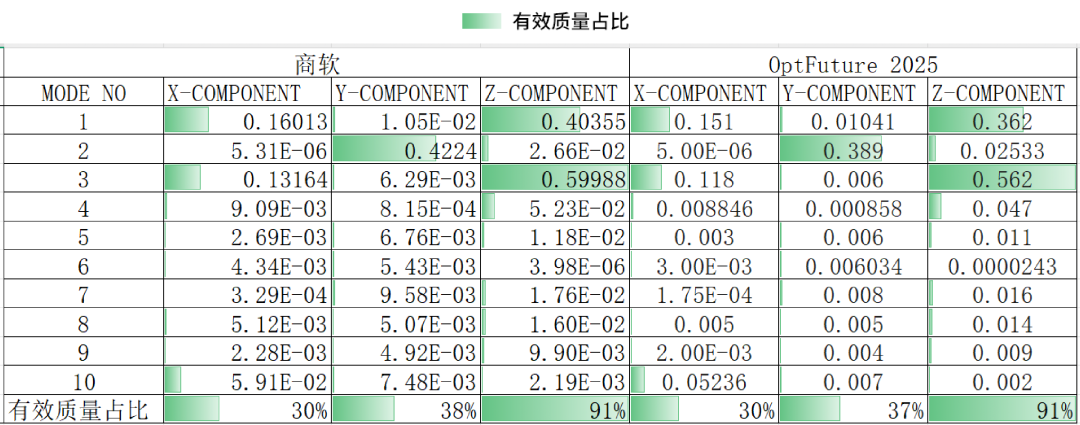
Table 3 summarizes the effective mass participation ratios in each direction for the first ten modes calculated using foreign commercial software and OptFuture. The foreign commercial software calculated the mass participation ratios for the three translational directions as 30%, 38%, and 91%, with the highest effective mass participation in the Z direction. OptFuture calculated the mass participation ratios for the three translational directions as 30%, 37%, and 91%, with the highest effective mass participation also in the Z direction.
Table 3 Effective Mass Participation Ratios Calculated by Foreign Commercial Software and OptFuture
 Conclusion
Using OptFuture effectively predicts the characteristic frequencies and mode shapes of the assembly, and accurate modal calculations provide a computational basis for the accuracy of modal-based linear dynamic analysis. Interested readers can directly visit our official website to register for a trial account for the software. The model parameters mentioned in previous articles and the OptFuture model can be obtained through our official WeChat account (see the QR code at the end) or customer service WeChat group.

Customer Service WeChat
ççPrevious Recommendations
OptFuture 2025.2.0 Major Release, Dual Upgrade in Functionality and Performance!

OptFuture Official Website Revamped, These Changes You Must Know!
OptFuture | Post-Processing and Visualization (Part II)