1. Overview
Valgrind is an open-source memory debugging and performance analysis tool used to help developers identify memory errors in programs, such as memory leaks, use of uninitialized memory, illegal memory access, and other issues. It is widely used on the Linux platform and supports multiple processor architectures.
2. Using Valgrind
1. Basic Format
valgrind --tool=memcheck --gen-suppressions=all --show-leak-kinds=all --log-file=<filename> --leak-check=yes ./your_app arg1 arg2...-
valgrind: This is a memory debugging toolset, where memcheck is one of the tools used to check memory-related errors.
-
–gen-suppressions=all: False positives are common during memory leak checks. Using this option, we can mark those false positives and generate suppression rules to let Valgrind ignore these specific cases in subsequent checks.
-
–show-leak-kinds=all: Show all memory leak information.
-
–log-file=<filename>: This option specifies the filename of the log file output by Valgrind. You can replace <filename> with the desired filename or path.
-
–leak-check=yes: This option tells Valgrind to check for memory leaks after the program finishes running. It will list any unreleased memory in the program. (Another way to write this is: –leak-check=full, which means the same thing.)
-
./your_app: This should be the path to the executable file you want to check. Replace your_app with the actual name of your program.
-
arg1 arg2…: These are the command-line arguments your program may need. Separate them with spaces and replace them with the actual parameters your program requires.
2. Valgrind Toolset
Valgrind toolset contains multiple tools, each aimed at different debugging, analysis, and performance optimization tasks. Here are some commonly used tools in the Valgrind toolset:
-
Memcheck: This is one of the most commonly used tools in Valgrind, used to detect memory errors in programs, such as memory leaks, uninitialized memory reads, illegal memory accesses, etc.
-
Cachegrind: Used to simulate the behavior of caches and branch predictors, helping to optimize the program’s cache usage and execution paths.
-
Callgrind: Used for program performance analysis, tracking function call relationships and execution counts, helping to identify performance bottlenecks in the program.
-
Helgrind: Specifically designed to detect concurrency errors in multithreaded programs, such as data races and deadlocks.
-
Massif: Used to analyze heap memory usage in programs, including heap allocation, deallocation, and heap memory snapshots.
-
DHAT (Dynamic Heap Analysis Tool): Used for in-depth analysis of heap memory allocation in programs, helping to identify issues related to memory allocation and usage.
-
BBV (Basic Block Vectors): Can be used to collect statistics on basic blocks in programs, helping to understand the execution paths and performance characteristics of the program.
Each tool has its specific uses and advantages, and you can choose the appropriate tool for program debugging, performance optimization, or memory analysis as needed.
Next, we will mainly introduce the use of the Memcheck tool.
3. Memcheck
Valgrind has four main usage scenarios for memory detection:
-
Using uninitialized memory
-
Memory leaks
-
Reading/writing after memory has been freed
-
Reading/writing at the end of a memory block
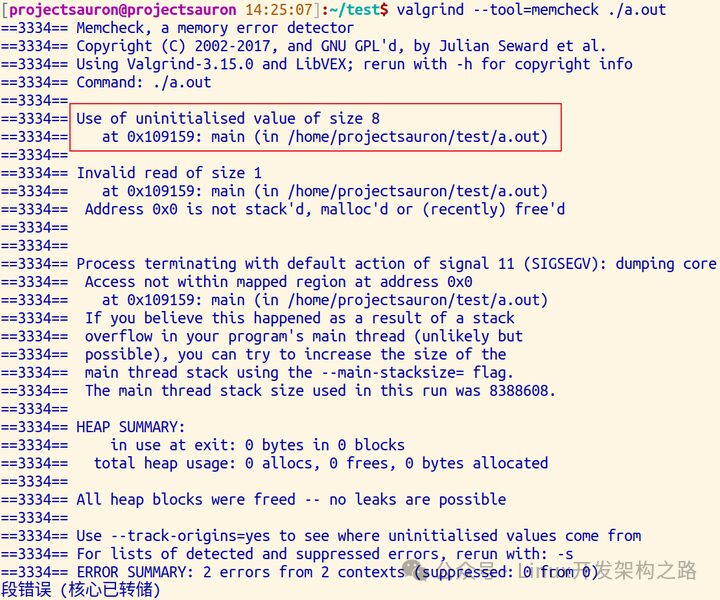
3.1 Using Uninitialized Memory
First, let’s look at an example:
#include <stdio.h>#include <stdlib.h>
int main(){    char *p;    char c = *p;
    printf("\n [%c]\n", c);
    return 0;}
As we can see, here we accessed a wild pointer. Next, compile:
$ gcc testThen use the Valgrind tool for analysis:
$ valgrind --tool=memcheck ./a.outError messages and the locations of the errors are printed out:
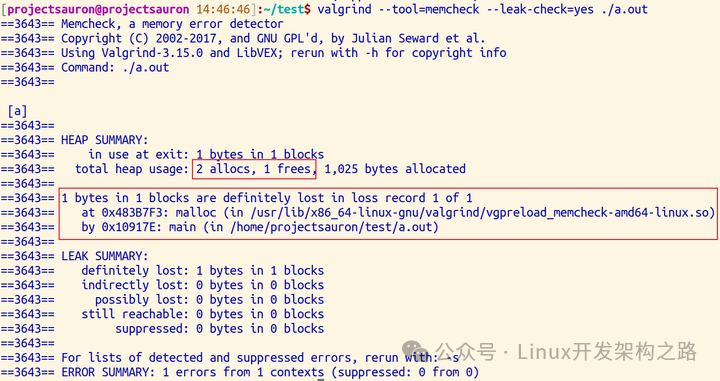
3.2 Memory Leaks
Let’s look at the code first:
#include <stdio.h>#include <stdlib.h>
int main(){    char *p = malloc(1);    *p = 'a';
    char c = *p;
    printf("\n [%c]\n", c);
    return 0;}
Here, we allocated an address for the pointer p, but we did not free this address before returning 0, which causes a memory leak. First, compile:
$ gcc testThen use the Valgrind tool for analysis:
$ valgrind --tool=memcheck --leak-check=full ./a.outThe result shows that the prompt indicates that alloc was done 2 times, but only 1 free was done, so a memory leak occurred, and below is the detailed information about the memory leak.
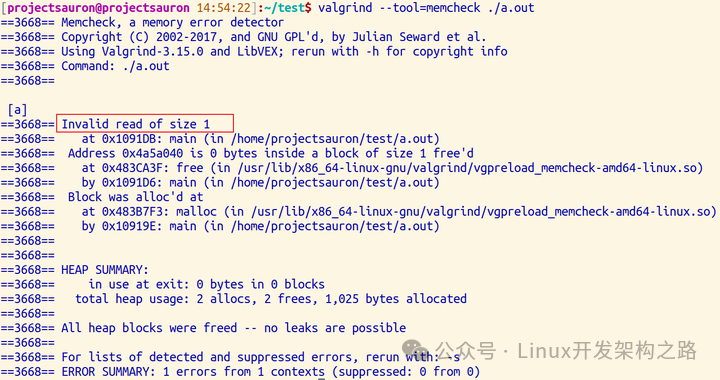
3.3 Reading/Writing After Memory Has Been Freed
The example code is as follows:
#include <stdio.h>#include <stdlib.h>
int main(){    char *p = malloc(1);    *p = 'a';
    char c = *p;
    printf("\n [%c]\n", c);
    free(p);    c = *p;
    return 0;}
After compiling, use Valgrind to check:
$ gcc test.c
$ valgrind --tool=memcheck ./a.out
In the above code, we have a pointer p that has released memory, and then we try to use the pointer to get a value. From the output below, we can see that Valgrind detected an invalid read operation and output the warning “Invalid read of size 1“.
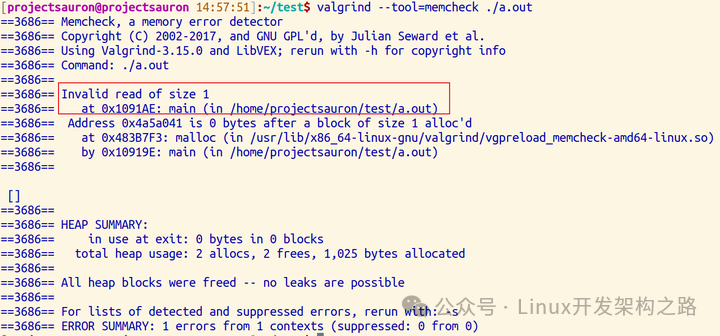
3.4 Reading/Writing at the End of a Memory Block
The code is as follows:
#include <stdio.h>#include <stdlib.h>
int main(){    char *p = malloc(1);    *p = 'a';
    char c = *(p+1);
    printf("\n [%c]\n", c);
    free(p);
    return 0;}
$ gcc test.c
$ valgrind --tool=memcheck ./a.outHere, we still have an illegal read, as we only allocated 1 byte of space:
4. Common Errors
Here are some common errors in log printing:
malloc/free: in use at exit: Memory was not released before exit
invalid write of size: Invalid write to memory, usually due to array out of bounds
invalid read of size: Invalid read from memory: usually due to array out of bounds
definitely lost /possibly lost /still reachable in loss record: Memory not released
-
definitely: Definitely lost. There is a memory leak in the program that should be fixed as soon as possible.
-
indirectly: Indirectly lost. This error may occur when using classes or structures with pointer members.
-
possibly: Possibly lost. In most cases, this should be treated the same as