In the book “Passive/Active Phased Array Radar, Electronic Scanning Arrays, and Typical Systems,” there is an animated visualization that some have asked how to create. Today, we will analyze it and provide a step-by-step guide on how to create it yourself.
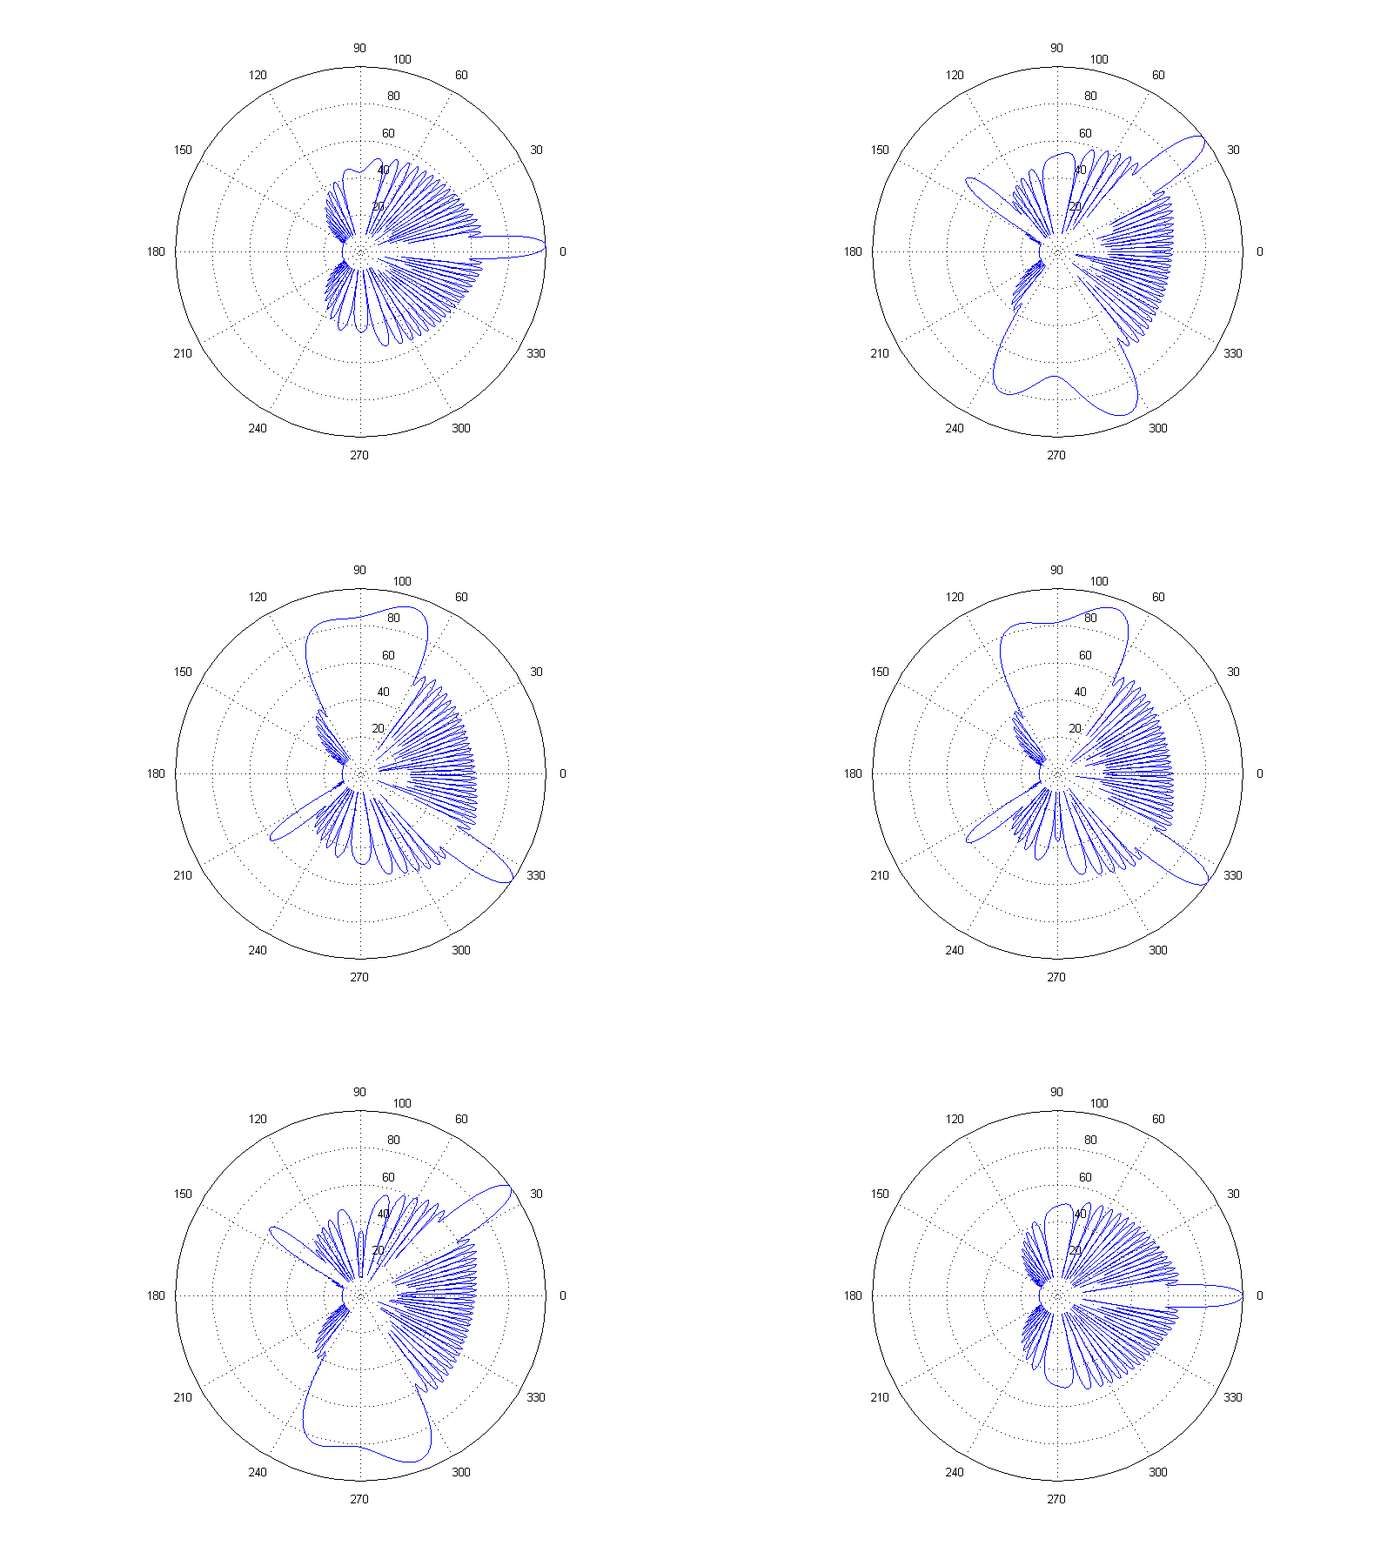
Animation Analysis:
We observe that this is a beam scanning diagram of a linear array in polar coordinates, where the outer circle is labeled with angles from 0 to 360°, with 0° indicating the direction perpendicular to the linear array. The concentric rings represent amplitude, with the marked values of 100, 80, 60… indicating dB levels.
The maximum beam gain is directed at 0°, with a maximum value of 100dB, and the side lobe is nearly 40dB lower than the main lobe, indicating that side lobe suppression weighting has been applied. Additionally, the beam shows a notch after scanning beyond 30 degrees.
Animation Simulation:
Here, we have made some simplifications. First, no side lobe suppression weighting has been applied. The amplitude has been normalized, meaning that at 0°, it is 0dB.
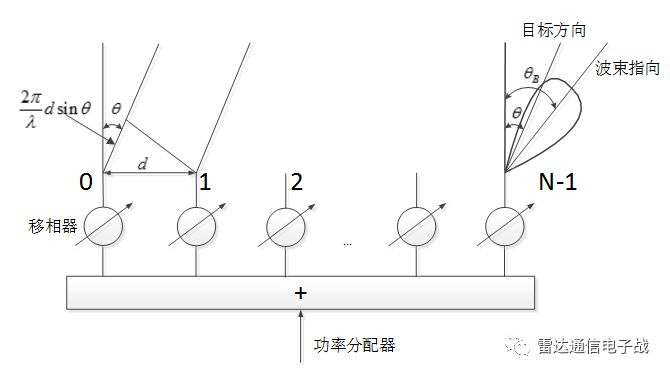
During the simulation, the settings were: N=32, d=λ/2, and the beam direction θB ranged from 0° to 60°, then back from 60° to 0°, resulting in the following animation:
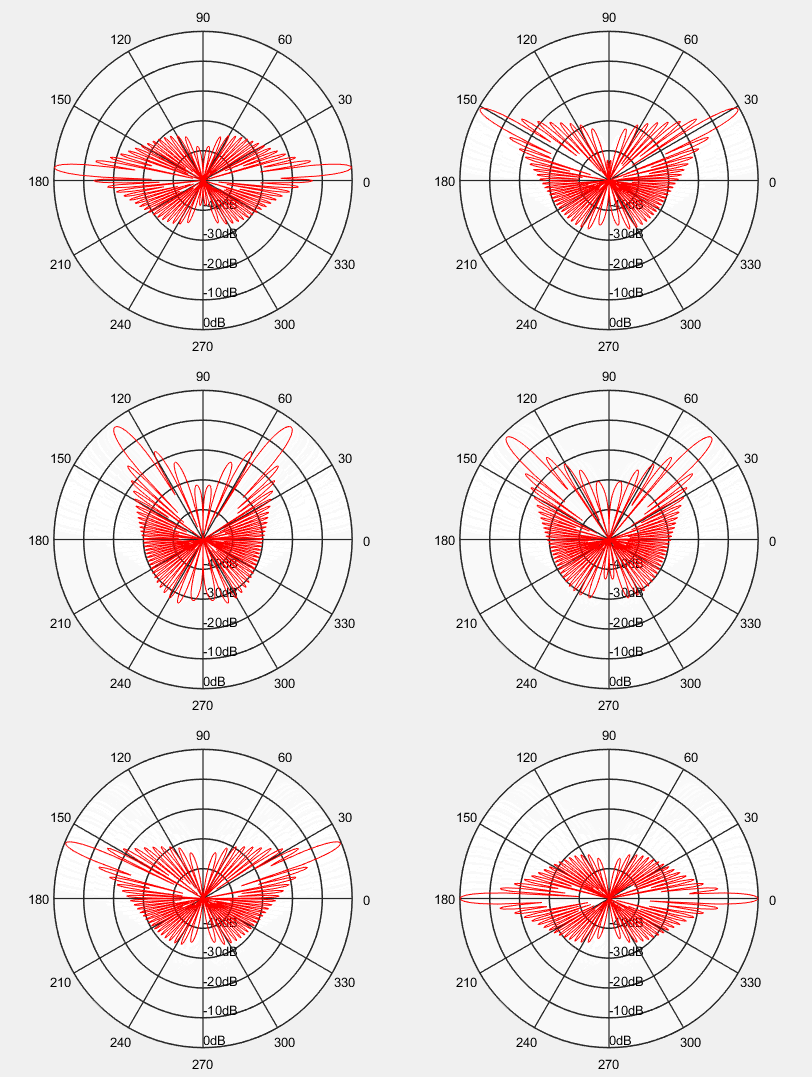
From this animation, we can see:
1. As the beam direction increases, the beam width becomes wider, doubling when reaching 60°.
2. As the beam direction increases, the gain also decreases.
3. No side lobe suppression weighting was applied, resulting in higher side lobes.
Several Knowledge Points:
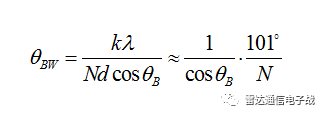
The relationship between beam width and scanning angle θB:
When the maximum scanning angle is θmax, to avoid the appearance of notches, the element spacing d and wavelength λ must satisfy the following relationship:
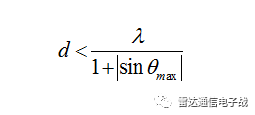
This means that when the element spacing is less than half a wavelength, even if scanning to 90°, no notches will appear. If you want to see the situation where notches occur, here is an example (setting d=0.7λ).
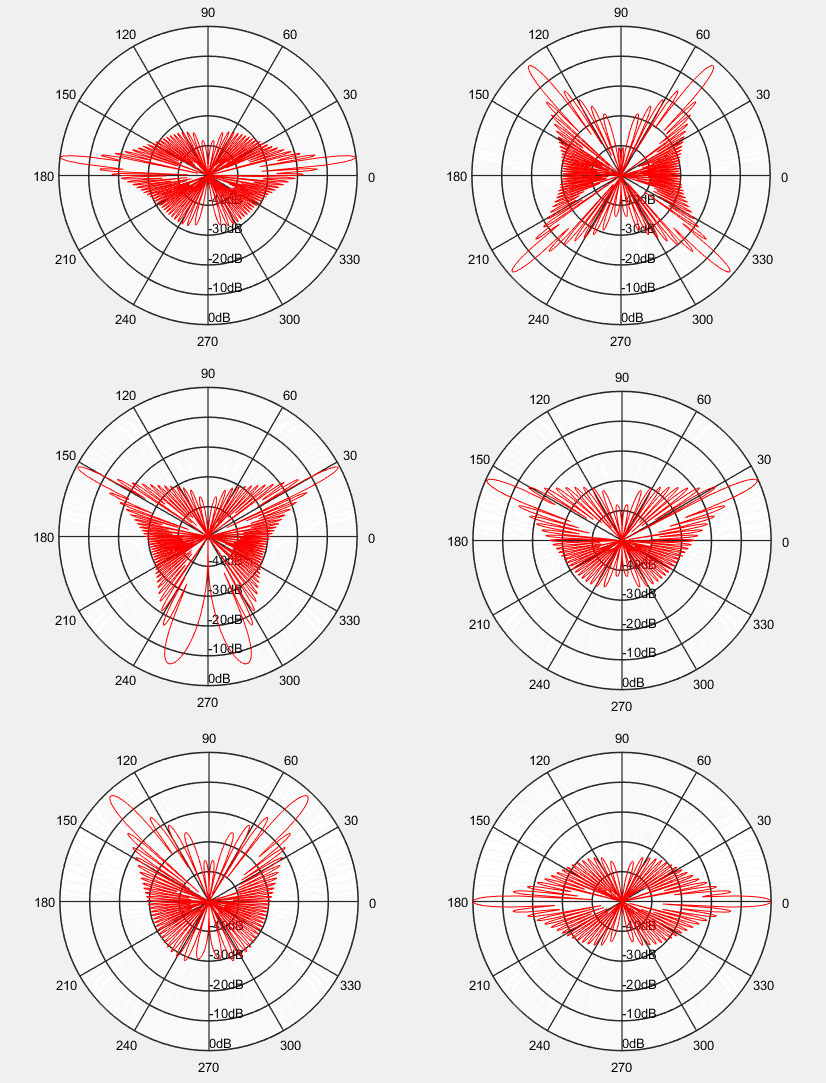
It is important to note that the beams appearing in the simulation from 90° to 270° are due to each element in this simulation being an omnidirectional antenna.
The simulation program is as follows:
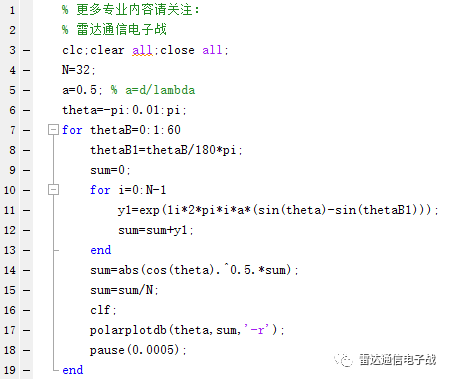
Matlab has a function called polarplot that can be used directly, but it does not represent in dB. The polarplotdb function and the above simulation program can be downloaded by sending “180724” directly.