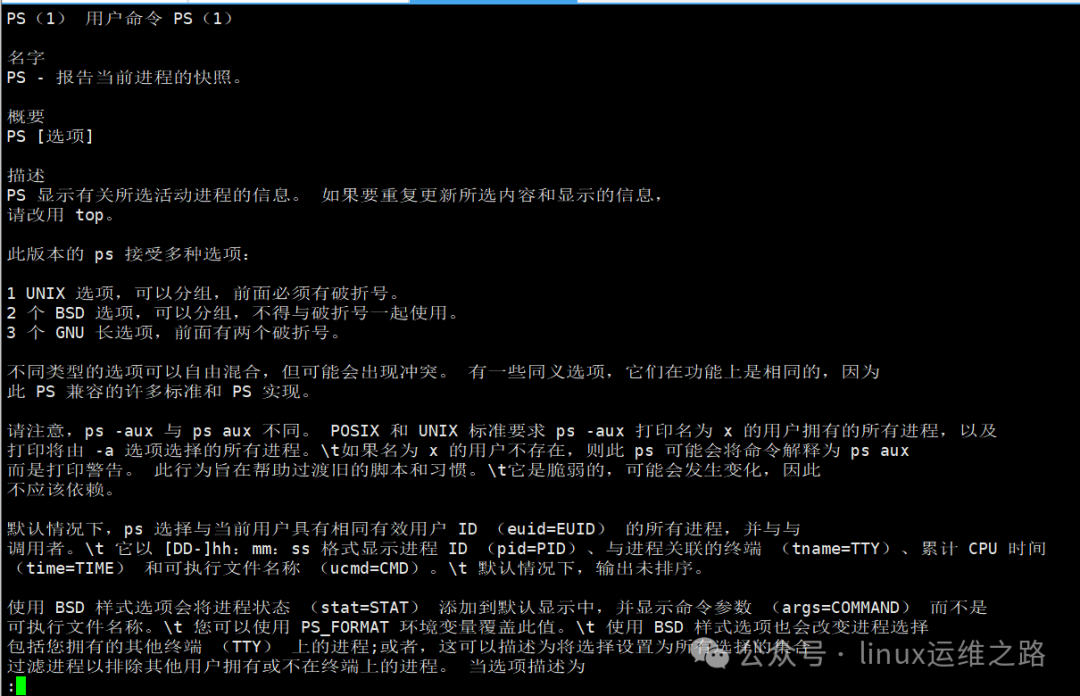
1. Basics of the ps Command ps (Process Status) is the core command in Linux systems for viewing process status, functioning like taking a “snapshot” of the running system, instantly presenting key information about all active processes.
Syntax Format The ps command supports three styles of options, and beginners often make mistakes by mixing formats.
UNIX Style – with a dash prefix, e.g., -ef
BSD Style – without a dash prefix, e.g., aux
GNU Long Option – with a double dash prefix, e.g., –forest
It is recommended to stick to one style in actual use to avoid mixing different style options.
2. Must-Learn Option Combinations
Two ways to view all processes
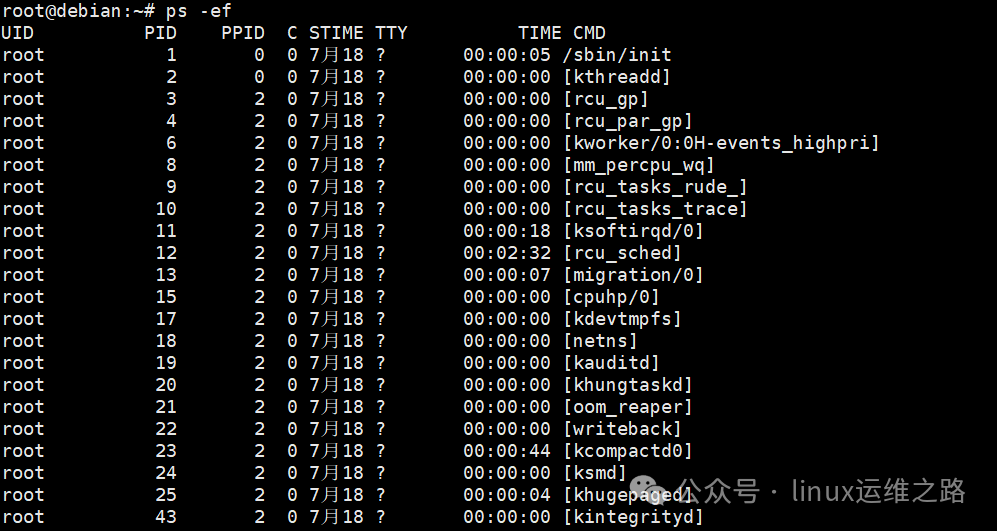
ps -ef (UNIX Style)This classic command for viewing all processes outputs: process owner (UID), process ID (PID), parent process ID (PPID), CPU usage (C), start time (STIME), controlling terminal (TTY), total CPU time used (TIME), and start command (CMD). It is suitable for scenarios that require tracing process parent-child relationships.
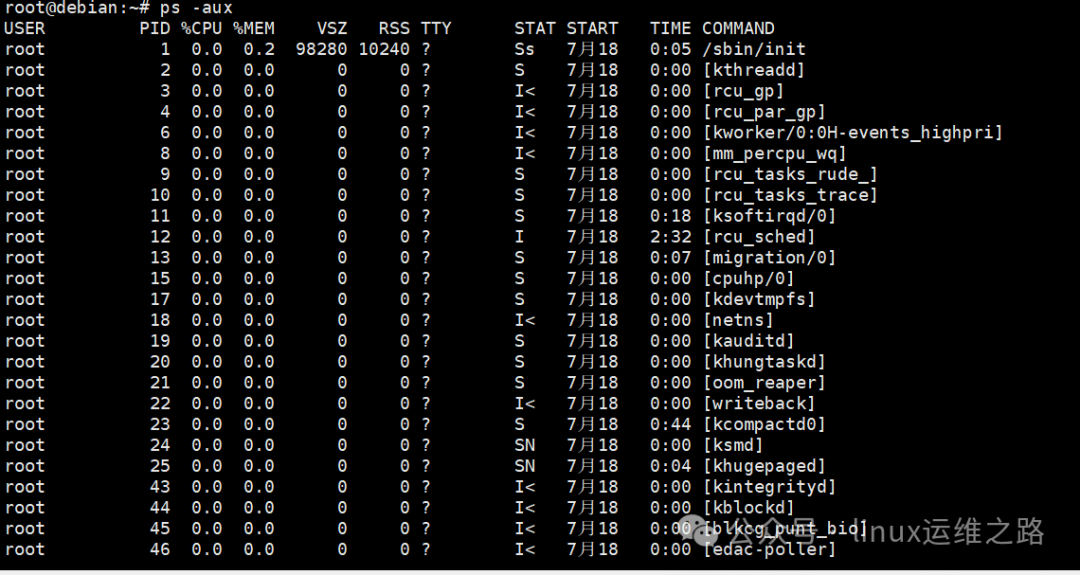
ps aux (BSD Style)This focuses more on resource usage display, additionally providing: memory usage (%MEM), virtual memory size (VSZ), physical memory usage (RSS), and process status (STAT). It is most commonly used by operations personnel when troubleshooting resource bottlenecks.
Practical Scenario Combinations
a. Visualizing Process Trees
ps -ejH or ps axjf, displaying the parent-child relationships of processes in a tree structure, quickly locating process families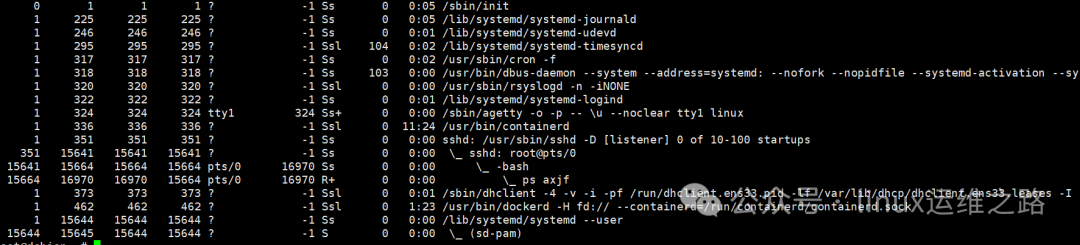
b. Real-time Monitoring of Specific Processes
watch -n 1 "ps -p 1234 -o %cpu,%mem,cmd", refreshing every second for the resource usage of the process with PID 1234c. Sorting Resource Usage
ps aux --sort=-%cpu (in descending order of CPU usage) ps aux --sort=-%mem (in descending order of memory usage)Practical Tip: Combine with the head command to quickly locate resource hogs, for example, ps aux –sort=-%mem | head -n 5 directly shows the top five processes by memory usage.

3. Detailed Explanation of Output Fields
Core Fields of ps -ef
| Field | Meaning | Practical Value |
| PID | Unique process identifier | Core basis for killing processes and monitoring processes |
| PPID | Parent process ID | Tracing process origins, such as finding the creator of an abnormal process |
| TTY | Controlling terminal | Usually shows “?” for background service processes |
| CMD | Start command | Direct basis for identifying process purposes |
Unique Fields of ps aux
%CPU/%MEM: Reflects the proportion of resource consumption by the process in real-time, requiring caution when exceeding 90%
VSZ/RSS: VSZ is the total amount of virtual memory used by the process (including parts not actually used), while RSS is the actual physical memory occupied (better reflecting real memory consumption)
STAT: Process status code, with the most common statuses being:
-
R: Running (currently occupying CPU or waiting for scheduling)
-
S: Sleeping (can be awakened by signals)
-
D: Deep sleep (usually waiting for disk IO, cannot be interrupted)
-
Z: Zombie process (terminated but not collected, requires attention)
-
T: Stopped state (usually triggered by Ctrl+Z)
Note: The STAT field may show combined states, such as Sl indicating a sleeping multithreaded process, R+ indicating a foreground running process.
4. Advanced Filtering and Formatting
Precisely locate processes by name
ps -C nginx (more efficient than ps -ef | grep nginx)Precisely locate processes,filtering by user
ps -U root shows only processes of the root userPrecisely locate processes,searching by parent process
ps --ppid 1234 lists all child processes of the parent process ID 1234Multiple PID queries
ps -p 123,456,789 simultaneously view multiple specified processesCustom output content: Use the -o option to extract fields as needed, avoiding information overload:
# Show only process ID, command name, and CPU usage ps -eo pid,comm,%cpu --sort=-%cpu # View key metrics of all nginx processes ps -o pid,user,%mem,rss -p $(pgrep nginx)Common field aliases: pid (process ID), user (owner), comm (command name), %cpu (CPU share), %mem (memory share)
5. Practical Combination Techniques
1. Count User Process Distribution
ps -ef | awk '{print $1}' | sort | uniq -c | sort -nrThis command can quickly count the number of processes owned by each user, suitable for resource auditing in multi-user server environments.
2. Handle High Memory Usage Processes
# Safely terminate the process with the highest memory usage pid=$(ps aux --sort=-%mem | awk 'NR==2 {print $2}') kill $pid && echo "Termination signal sent" sleep 3 if ps -p $pid >/dev/null; then kill -9 $pid && echo "Forcefully terminated process" fi3. Real-time Monitoring of Service Resource Usage
# Monitor CPU and memory usage of mysql every 2 seconds watch -n 2 "ps -p $(pgrep mysql) -o %cpu,%mem,cmd"4. Clean Up Zombie Processes
# Find zombie processes and their parent processes ps -eo pid,ppid,stat,cmd | grep 'Z'# Handle with caution: first try restarting the parent process, if ineffective then kill the parent process kill -HUP <parent process PID> # Gentle restart # If still ineffective: kill -9 <parent process PID> (will cause child processes to be taken over and cleaned by init)6. Pitfall Guide: Differences Between ps and top
Beginners often confuse these two commands:
ps: Static snapshot, suitable for precise querying of process attributes
top: Dynamic real-time monitoring, suitable for observing resource change trends
Common Anomaly State Handling
D state processes: Long-term D state (over 5 minutes) usually indicates disk IO failure, requiring storage system checks
Numerous Z processes: Indicates design flaws in the parent process, which has not correctly reclaimed child process resources, requiring application repair
High CPU usage: %CPU exceeding 100% may be a multithreaded process, requiring further analysis of thread states with pstack
Performance Impact Explanation: The ps command itself is lightweight, directly reading information from the /proc filesystem, and will not cause significant system load. However, in extreme scenarios with over 100,000 processes, complex filtering (like ps -ef | grep) may temporarily occupy CPU, and using pgrep is recommended instead.
Operations veterans remind: Regularly execute ps aux –sort=-%cpu | head -n 10