
The
Eighth
Using MATLAB for MK Test
—— Complete code attached at the end
Star
System
Author: Eighth Star System – Stone Man
Email: [email protected]
Read Data

clc;clear;close all;

load data1.mat
year = data1(:,1);
data = data1(:,2);
Trend Test

s = 0;
len=size(data,1);
for m=1:len-1
    for n=m+1:len
        if data(n) > data(m)
            s = s+1;
        elseif data(n) == data(m)
            s = s+0;
        elseif data(n) < data(m)
            s = s-1;
        end
    end
end
vars = len*(len-1)*(2*len+5)/18;
% Calculate variance
if s > 0
    zc = (s-1)/sqrt(vars);
elif s < 0
    zc = (s+1)/sqrt(vars);
end
% zc>0 indicates an increasing trend, zc<0 indicates a decreasing trend
% When the absolute value of zc is greater than or equal to 1.64, 1.96, 2.58, it indicates that the time series has passed the significance test at confidence levels of 90%, 95%, and 99% respectively
Change Test

% Calculate UF
Sk=zeros(size(data)); UF=zeros(size(data)); s1=0;
for i=2:n
    for j=1:i
        if data(i)>data(j)
            s1=s1+1;
        end
    end
    Sk(i)=s1;
    E=i*(i-1)/4;
    Var=i*(i-1)*(2*i+5)/72;
    UF(i)=(Sk(i)-E)/sqrt(Var);
end
% Calculate UB
data2=zeros(size(data));
Sk2=zeros(size(data)); UBk=zeros(size(data)); s2=0;
for i=1:n
data2(i)=data(n-i+1);
end
for i=2:n
   for j=1:i
       if data2(i)>data2(j)
         s2=s2+1;
       end
   end
   Sk2(i)=s2;
   E=i*(i-1)/4;
   Var=i*(i-1)*(2*i+5)/72;
   UBk(i)=0-(Sk2(i)-E)/sqrt(Var);
end
UB=zeros(size(data));
for i=1:n
    UB(i)=UBk(n-i+1);
end
Plotting

figure(i)
plot(year,UF,'bd-','LineWidth',1.2);
hold on
plot(year,UB,'ro-','LineWidth',1.2);
hold on
plot(xlim,[1.96,1.96],'g-.','LineWidth',0.8) % Draw significance line
hold on
plot(xlim,[-1.96,-1.96],'g-.','LineWidth',0.8)% Draw significance line
hold on
plot(xlim,[0,0],'k-','LineWidth',0.8)
hold on
axis([1991 2022 -3 5])
xlabel('Year','FontSize',13,'FontWeight','bold','FontName','Songti');
ylabel('Statistic','FontSize',13,'FontWeight','bold','FontName','Songti');
legend('UF','UB','0.05 significance level','Location','best', ...
    'FontSize',10,'FontWeight','bold','FontName','Songti');

% If UF value>0, it indicates a continuous growth trend, and the value is above the 0.05 significance level, indicating it passed the 0.05 significance test

% The intersection of UF and UB curves falls within the confidence interval [-1.96, 1.96], and determining the specific year of the intersection indicates that year shows a sudden growth state;

% If the intersection of UF and UB curves does not fall within the test range, it indicates that the intersection did not pass the 0.05 test, so the parameter's sudden increase does not have suddenness
Image

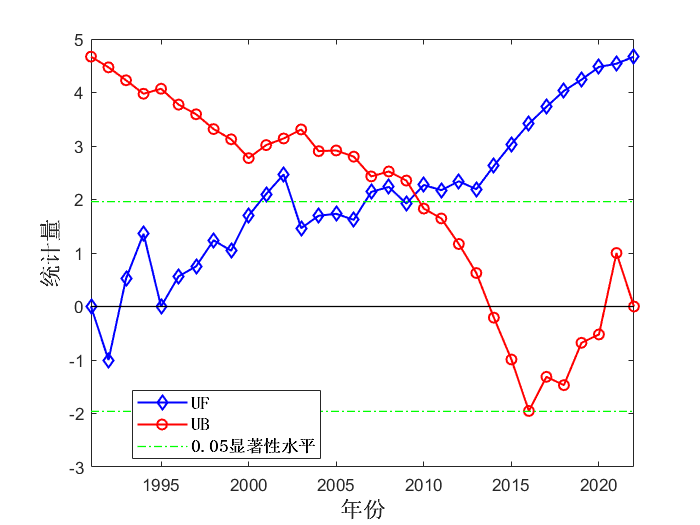
1
Complete Code

clc;clear;close all;
load data1.mat
year = data1(:,1);
data = data1(:,2);
s = 0;
len=size(data,1);
for m=1:len-1
    for n=m+1:len
        if data(n) > data(m)
            s = s+1;
        elseif data(n) == data(m)
            s = s+0;
        elseif data(n) < data(m)
            s = s-1;
        end
    end
end
vars = len*(len-1)*(2*len+5)/18;
if s > 0
    zc = (s-1)/sqrt(vars);
elif s < 0
    zc = (s+1)/sqrt(vars);
end
Sk=zeros(size(data)); UF=zeros(size(data)); s1=0;
for i=2:n
    for j=1:i
        if data(i)>data(j)
            s1=s1+1;
        end
    end
    Sk(i)=s1;
    E=i*(i-1)/4;
    Var=i*(i-1)*(2*i+5)/72;
    UF(i)=(Sk(i)-E)/sqrt(Var);
end
data2=zeros(size(data));
Sk2=zeros(size(data)); UBk=zeros(size(data)); s2=0;
for i=1:n
data2(i)=data(n-i+1);
end
for i=2:n
   for j=1:i
       if data2(i)>data2(j)
         s2=s2+1;
       end
   end
   Sk2(i)=s2;
   E=i*(i-1)/4;
   Var=i*(i-1)*(2*i+5)/72;
   UBk(i)=0-(Sk2(i)-E)/sqrt(Var);
end
UB=zeros(size(data));
for i=1:n
    UB(i)=UBk(n-i+1);
end
year=1991:2022;
figure(i)
plot(year,UF,'bd-','LineWidth',1.2);
hold on
plot(year,UB,'ro-','LineWidth',1.2);
hold on
plot(xlim,[1.96,1.96],'g-.','LineWidth',0.8)
hold on
plot(xlim,[-1.96,-1.96],'g-.','LineWidth',0.8)
hold on
plot(xlim,[0,0],'k-','LineWidth',0.8)
hold on
axis([1991 2022 -3 5])
xlabel('Year','FontSize',13,'FontWeight','bold','FontName','Songti');
ylabel('Statistic','FontSize',13,'FontWeight','bold','FontName','Songti');
legend('UF','UB','0.05 significance level','Location','best', ...
    'FontSize',10,'FontWeight','bold','FontName','Songti')
Data: Time series data
Access to the data in this article:

Reply in the public account:
“MATLAB MK Test”


Scan to join the group and join us,
Data will be sent to the group files.

Article Editor: Zhou You