After the boom of large models, many enterprises have explored and practiced related applications using these models. We found that large models perform better when solving isolated problems. However, they also raise safety and hallucination issues. Today, we will analyze the pain points of traditional data analysis, the construction methods of intelligent analysis using large models, and the value and practice of AI agents in the field of intelligent analysis through relevant case studies.
Guest Speaker|Li Fei (PhD), Head of AI at Shushi Technology
The content has been condensed. For the full video recording and slides from the expert, please scan the code to receive them.

01
Three Major Pain Points of Traditional Data Analysis
So, what issues exist in traditional data analysis before integrating with agent capabilities? First is the pain of management teams; existing data products cannot quickly produce in-depth conclusions end-to-end.
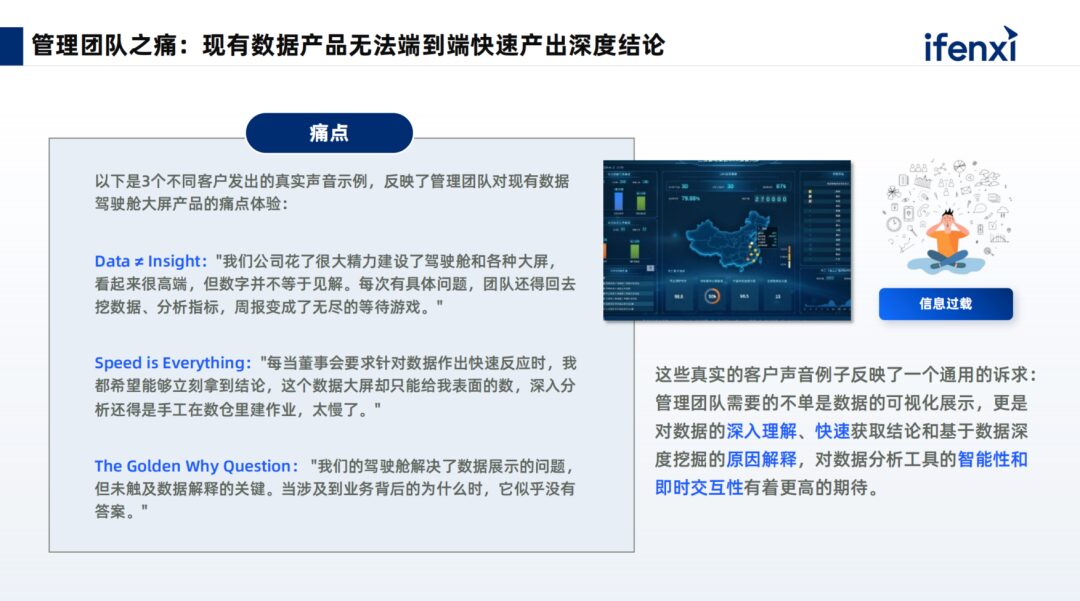
In team management, most enterprises have a business cockpit operated by the BI or business analysis team. However, when management teams express their data requests and seek insights, they do not merely want data presentation and visualization; they hope to understand the reasons behind the changes and then take a series of decision-making actions. If we follow the traditional task assignment chain, the demand response time is often long. First, the requirements must be communicated to the analysis team. If data is missing, it must then be passed to the data team. By the time the results are returned to the management team, decision-making can be delayed, affecting real-time decisions.
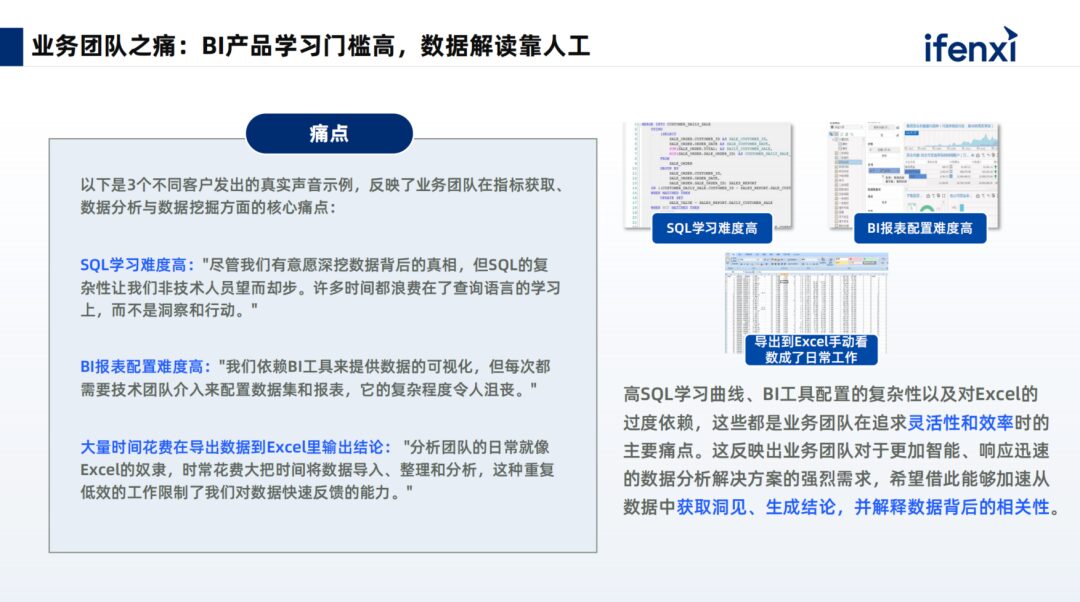
Secondly, there is the pain of business teams; BI products have a high learning curve, and data interpretation relies on manual effort.
BI personnel are a valuable asset within enterprises. The learning difficulty of complex BI is relatively high. Business personnel need to be very familiar with which metrics correspond to which datasets, what aggregation functions to use, and what filtering criteria to apply. Moreover, current BI products are designed to be sufficiently flexible, resulting in very complex functionalities. A single product may have dozens or even hundreds of functions, and without undergoing complete training, users may not know where these functions are hidden. The functionalities of BI products are often hidden beneath the surface, making them difficult to use, and they are primarily used for data presentation, requiring manual summarization for generating data conclusions. In fact, there is no good solution for the last mile issue.
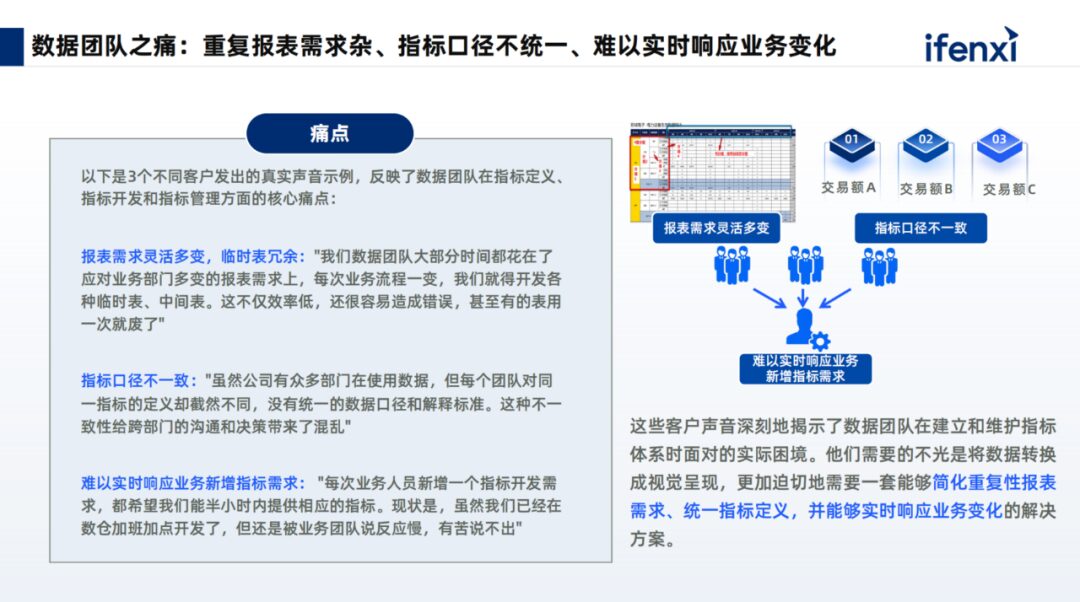
Additionally, the data team faces challenges; business requirements are complex, and inconsistent data metrics across departments make it difficult to ensure timely responses to changing business needs.
The data team, when dealing with numerous tables in the data warehouse, encounters issues such as different meanings for the same name or different names for the same meaning, or inconsistent definitions of metrics across departments. Data developers often have to verify data issues and coordinate with different departments to achieve alignment and consistency.
02
Building Intelligent Analysis and Its Capabilities
Data analysis has related pain points for the three different roles mentioned above. How does intelligent analysis address these issues?
Looking purely at data retrieval, there are three routes based on large models.
Code is applied in flexible analysis methods similar to Python, suitable for small data volume analysis. However, when facing enterprise-level analysis, resource pressure and computational complexity often hinder successful execution of tasks.
Faced with thousands of internal tables, how do we label tables? How do different tables relate to each other? Are there metric conflicts or inconsistencies between different tables? And when generating complex SQL, should we perform hard commits or optimize the SQL logic? These are all issues we face.
We choose to execute using the Text to Metrics approach through the mechanism of agents.
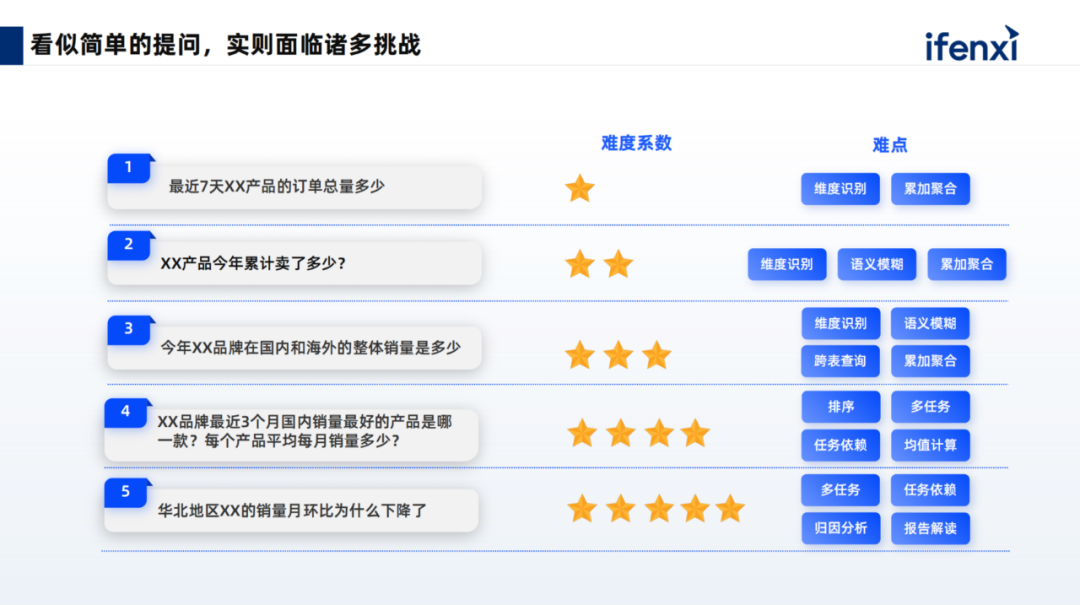
The above image summarizes some real customer issues. Large models, based on language interaction, cannot limit the way questions are asked.
The first question is, “What is the total order quantity of a certain product in recent days or months?”
This question is easily understood by the large model, as it is a single task, and for fields such as order quantity, specific products, and time dimensions, it can be accurately recognized with a single query.
In the second question, large models can gradually begin to demonstrate their advantages, especially in understanding colloquial language and aligning standardized semantics for ambiguous meanings. Through NLP techniques, they learn from vast amounts of data and have good alignment capabilities in resolving semantic ambiguities, which is also an emergent ability of large models in intent understanding and semantic alignment.
The third question in data analysis often involves two tables for domestic and international sales. Both fields for sales are named sales_count. If we label each sales_count, when performing a union all or joining the two tables, the generated SQL results may be inaccurate. The solution for this scenario is to flatten or pre-flatten all data through data modeling and align them to the corresponding metric fields through semantic understanding.
The fourth and fifth questions are complex tasks, as we cannot limit the questions users ask. If a user submits a long sentence, it will be broken down into several tasks.
The fourth question involves first querying the sales of each product for a certain brand over the past three months, and then based on the query results, identifying the top-selling products and calculating the average monthly sales of those products.
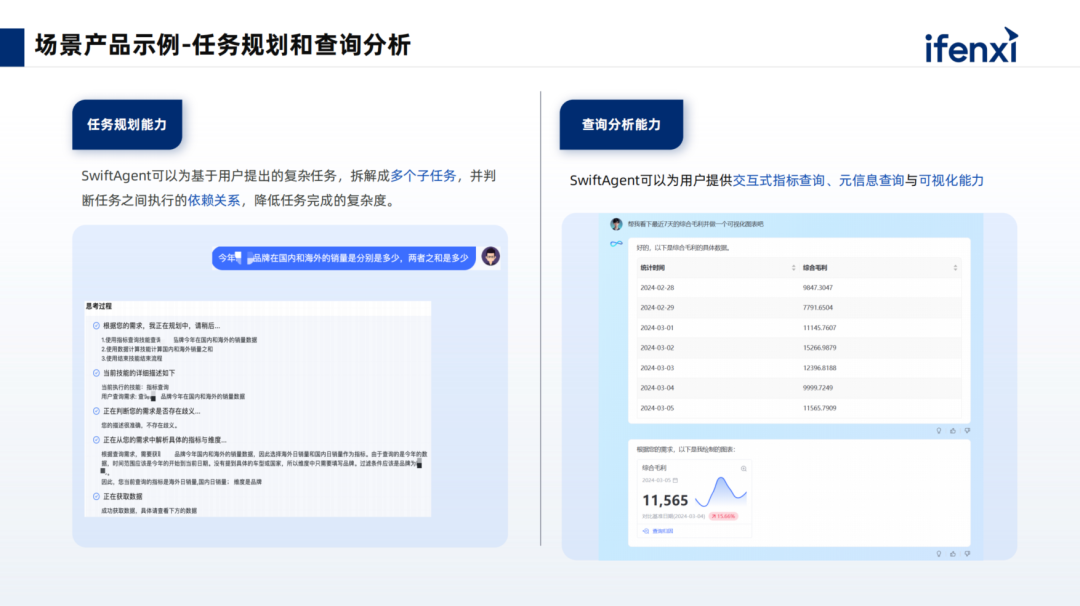
This demonstrates why we need to leverage agents; agents can break a single sentence into multiple simple sub-tasks and provide dependencies between the tasks (whether serial or parallel). By executing each task sequentially, users do not need to focus on the intermediate processes. After task execution, the final results are extracted and returned to the user.
The fifth task is even more complex, as it involves multiple algorithmic capabilities. For example, if management asks, “Why did the sales in North China decline last month?” we not only need to check last month’s data but also compute the month-on-month data from the previous month and determine if there was a decline. Furthermore, we need to invoke attribution capabilities, as the algorithm for attribution is not inherently part of the large model. Therefore, we must use a plugin-based approach to allow the large model to schedule and fill the previous results as parameters into the corresponding plugins, generating the final results.
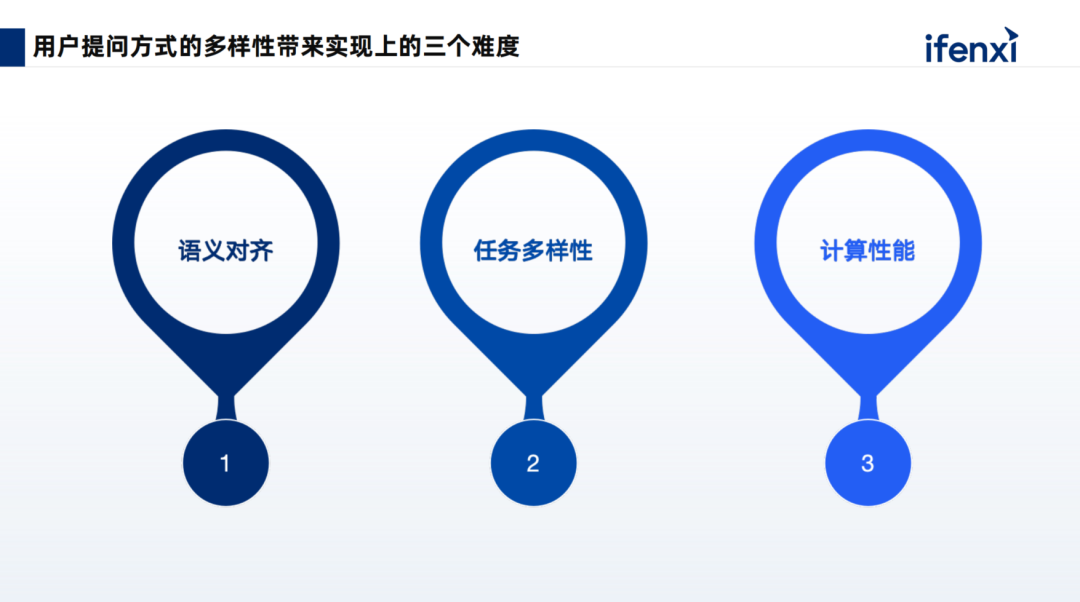
In addition, we also need the extensibility of large models, the collaboration of large and small models, and the formation of an overall agent mechanism to meet the diverse question-and-answer scenarios and complex problems of different customers within the enterprise. For the five issues mentioned above, we analyzed the difficulty and pain points of each. Overall, they involve three aspects.
1. Semantic Alignment, how to align user colloquial queries with metric fields, dimension fields, and even other API input parameters.
2. Task Diversity, when users pose a complex question or goal, the large model cannot execute it directly. However, it can break down the goal or complex task into multiple sub-tasks, executing each sub-task collaboratively to fulfill the user’s final query requirement.
3. Computational Performance, especially for conversational analysis, users have relatively high demands for this computational performance. They should not have to wait too long for results to be returned for a question. Computational performance and query performance need significant improvement to meet the scenarios of conversational analysis, truly achieving the goal of asking and receiving answers.
What are the suitable solutions for the three issues?
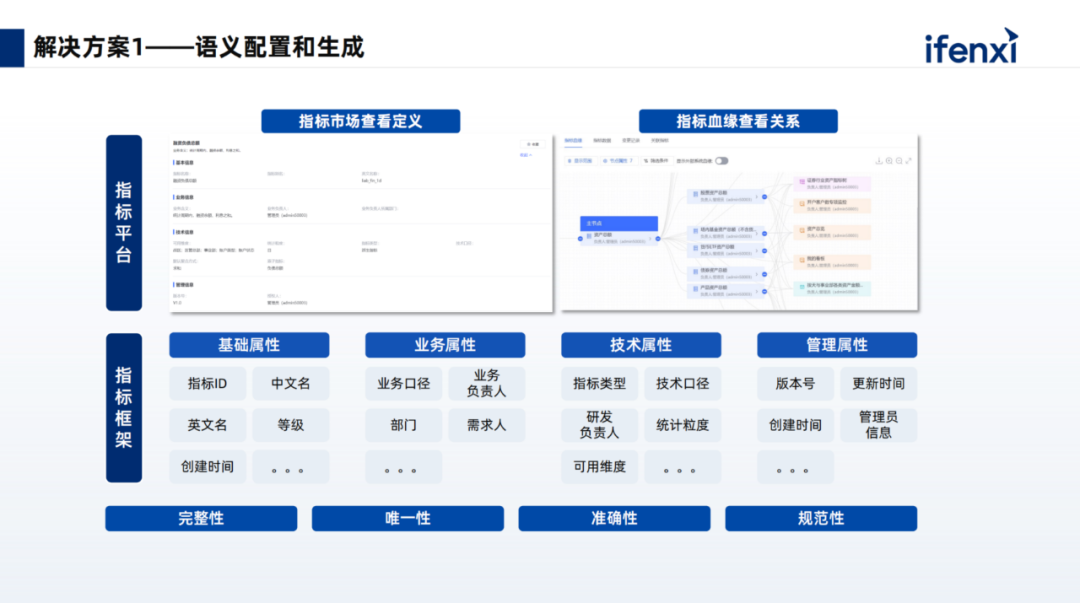
The first aspect involves semantic enhancement configuration, generating and configuring metric semantics for enterprise business data. It is important to know the names of the metrics, business criteria, and application scenarios. Users may not always accurately know which metrics to inquire about in which scenario; they are more likely to describe the scenario and, based on similarity and indexing, find the metrics. This is the purpose of configuring business criteria and the names and aliases of metrics, helping the large model understand users and aligning their descriptions to the appropriate metrics. This involves parsing out the user metrics, dimensions, and time elements and filling them into the standard metric query API. Then, through API scheduling, optimized SQL is generated and submitted to the underlying database engine for querying, resulting in faster performance.
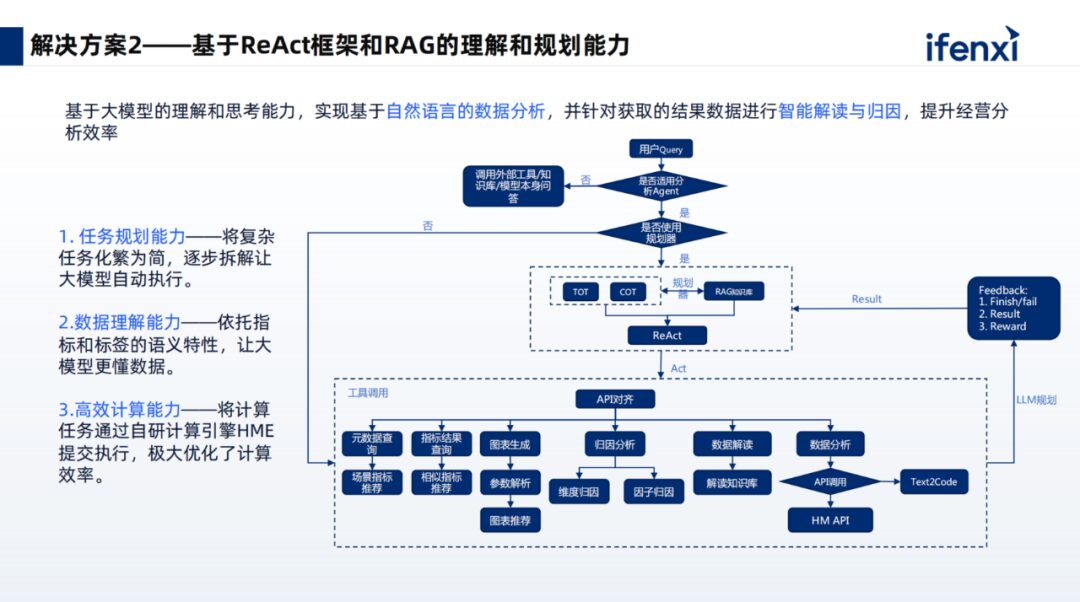 The second aspect, addressing task diversity, primarily utilizes the agent mechanism. In constructing agents, we mainly employ dynamic thought modules, positive examples, and negative experiences to enhance the model’s understanding and execution effectiveness.
Dynamic thought modules introduce different thinking methods for different problems. For example, a step-by-step approach can be used for purely computational issues, while a divided-in approach can be applied to complex tasks.
Additionally, we will dynamically introduce successful examples and thought trajectories for similar queries, as well as negative examples, allowing the large model to reflect on them. This way, it learns from successes while also reflecting on difficulties and mistakes, thus minimizing the generation of incorrect results and maximizing the accuracy of planned breakdowns.
After planning and breakdown, we execute sub-tasks through plugin calls, using the large model to combine previous and current results with queries, parsing them into intent understanding, and calling the necessary plugins, filling in the parameters to trigger plugin execution. For instance, in a metric query, the three elements of metrics, dimensions, and time are parsed out and filled into standardized interfaces. Small models may also be used, such as for attribution, predictive algorithms, and anomaly detection algorithms. Once the overall results are returned, we utilize a reflection mechanism to determine if the user’s query expectations were met. If not, a new planning cycle is initiated.
The second aspect, addressing task diversity, primarily utilizes the agent mechanism. In constructing agents, we mainly employ dynamic thought modules, positive examples, and negative experiences to enhance the model’s understanding and execution effectiveness.
Dynamic thought modules introduce different thinking methods for different problems. For example, a step-by-step approach can be used for purely computational issues, while a divided-in approach can be applied to complex tasks.
Additionally, we will dynamically introduce successful examples and thought trajectories for similar queries, as well as negative examples, allowing the large model to reflect on them. This way, it learns from successes while also reflecting on difficulties and mistakes, thus minimizing the generation of incorrect results and maximizing the accuracy of planned breakdowns.
After planning and breakdown, we execute sub-tasks through plugin calls, using the large model to combine previous and current results with queries, parsing them into intent understanding, and calling the necessary plugins, filling in the parameters to trigger plugin execution. For instance, in a metric query, the three elements of metrics, dimensions, and time are parsed out and filled into standardized interfaces. Small models may also be used, such as for attribution, predictive algorithms, and anomaly detection algorithms. Once the overall results are returned, we utilize a reflection mechanism to determine if the user’s query expectations were met. If not, a new planning cycle is initiated.
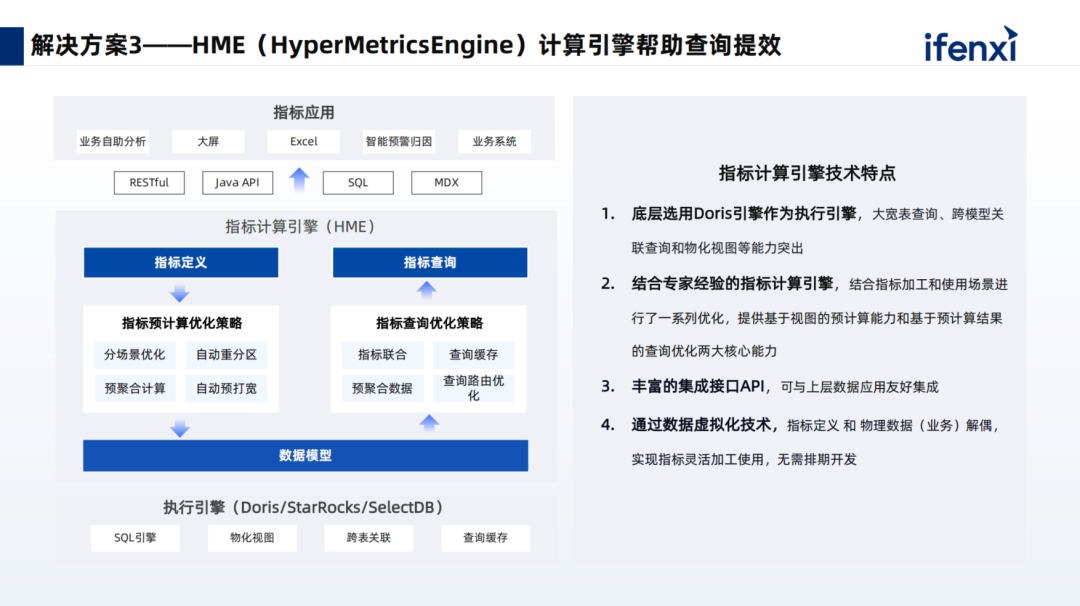
The third aspect involves our self-developed HME (Metric Calculation Engine), which is based on OLAP databases (Apache Doris/Starrocks). It abstracts metric pre-calculation into Metric Indexes (analogous to database indexes), enabling even complex year-on-year comparisons to provide queries in seconds. The configuration of Metric Indexes comes from built-in industry scenarios, user configurations, and large model analyses. HME generates indexes through a combination of heuristic rules and cost models, allowing users to weigh performance, cost, and flexibility according to their needs.
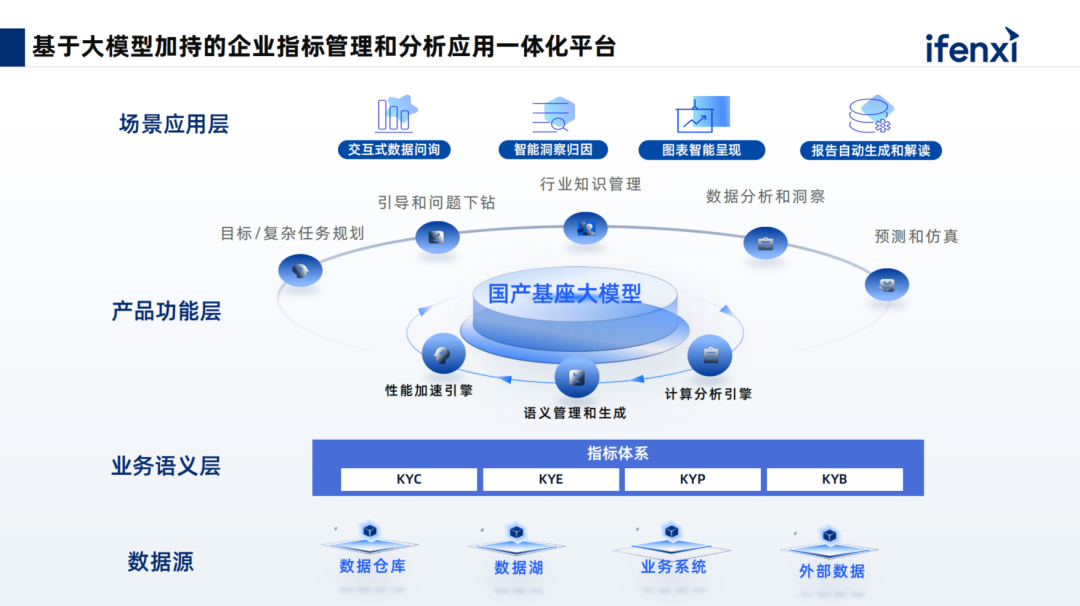
The overall architecture of Shushi Technology’s large model-enhanced intelligent analysis product is shown above. After data is ingested, performance acceleration is achieved based on Shushi’s self-developed capabilities, including semantic management configuration and computational analysis engines.
The upper layer completes complex task planning and guides users through question drilling. Users of conversational products often face the challenge of not knowing how to ask questions or what to do next after completing a previous analysis step. We will address the cold start problem and the issue of continuous question drilling by constructing a knowledge chain of analytical thinking, providing suggested actions for relevant tasks to help users conduct heuristic exploratory analysis.
The product also possesses other complex analytical capabilities, including attribution, early warning, predictive simulation, etc., ultimately achieving the goal of ‘ask and receive’ for users on this interface. It also supports report generation and downloading after analysis work is completed, as well as one-click access and forwarding via IM, achieving a complete closed loop in data analysis scenarios.
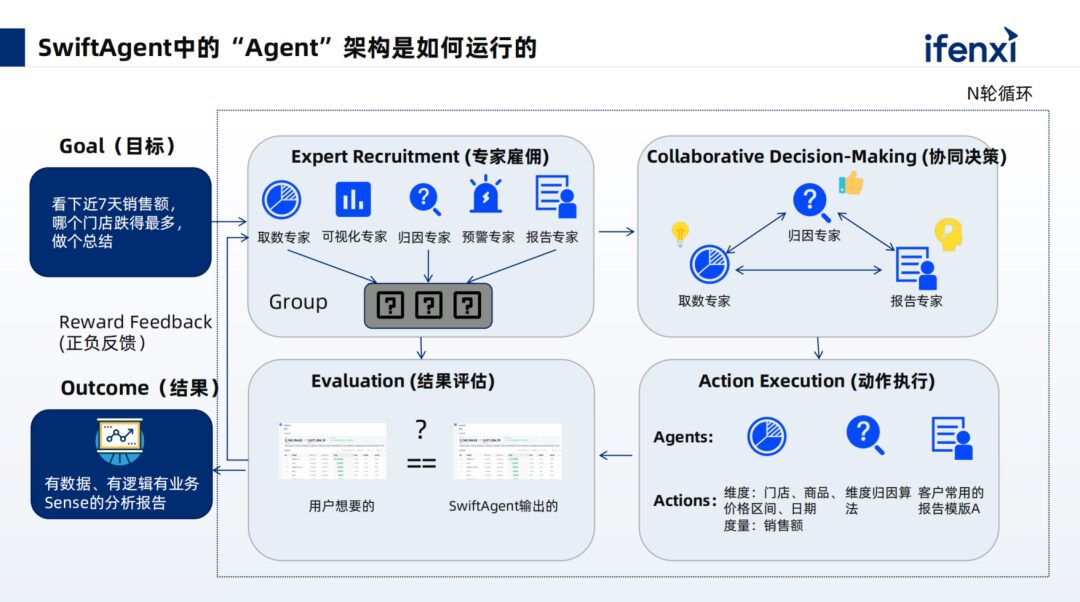 The running architecture of Shushi Technology’s large model intelligent analysis product, SwiftAgent, employs a multi-agent mechanism. When users pose questions, the analysis skills are broken down into related expert mechanisms. During the planning phase, the large model must understand how many skills it currently possesses and plan the relationships between preceding and subsequent tasks. Through task collaboration, tasks are aligned with actions at the skill level, and the results from each layer are summarized to evaluate whether the goals are achieved or if new planning and iteration are necessary. Ultimately, a data-driven, logical analysis report that combines business sense is presented to the user.
When building the product, we also considered several points:
1. Regarding agent task planning, how can users trust our actions and the breakdown of tasks?
We will present the specific steps of task breakdown, informing users of each step’s approach and whether the final task has been completed. Users will clearly understand how the large model assists in execution. For instance, in metric queries, the queried metrics and dimensions can be fed back to clients in colloquial or textual forms.
We have thought about this level; if we provide the underlying SQL to clients, not all clients understand code or SQL, making it a black box for them. Therefore, Shushi Technology’s products can present more colloquial or textual content, making it more trustworthy for clients at the understanding level.
2. For the presentation of designs and tables, Shushi Technology adopts a combination of LUI and GUI. Users can also achieve interactive chart transformations, filtering, and selection.
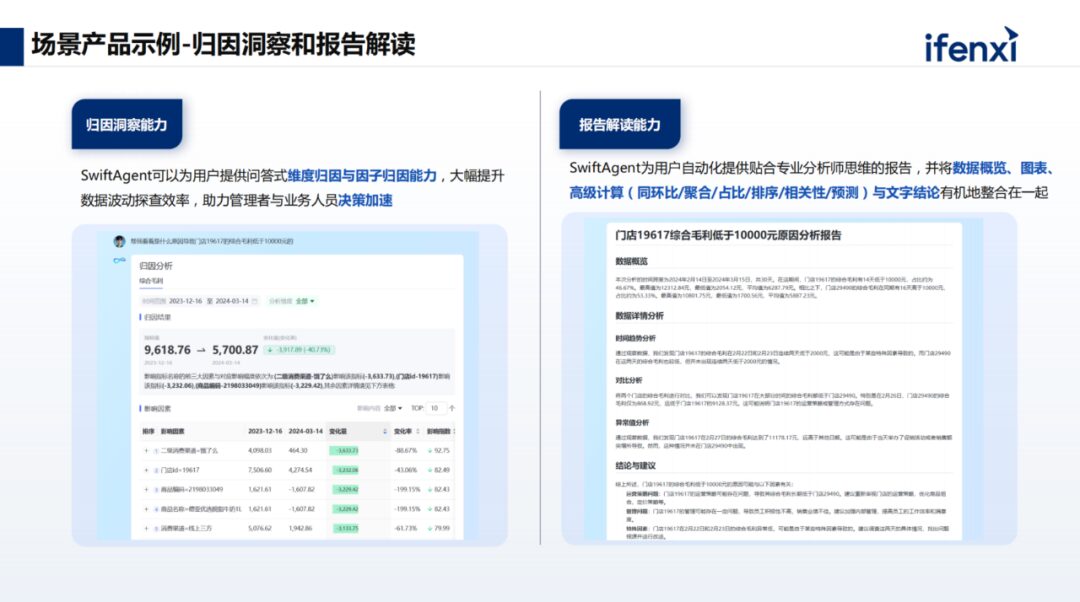
3. In terms of attribution, we not only leverage small model attribution algorithms to assist the large model in collaborative problem-solving but also present the overall results. For instance, providing a summary of related text helps clients avoid confusion when querying data regarding specific data meanings and how to drill down.
4. Regarding report interpretation, we will utilize prompts for template learning, enabling the model to generate similar report summaries based on reference templates to present to clients, who can also download and forward them.
The running architecture of Shushi Technology’s large model intelligent analysis product, SwiftAgent, employs a multi-agent mechanism. When users pose questions, the analysis skills are broken down into related expert mechanisms. During the planning phase, the large model must understand how many skills it currently possesses and plan the relationships between preceding and subsequent tasks. Through task collaboration, tasks are aligned with actions at the skill level, and the results from each layer are summarized to evaluate whether the goals are achieved or if new planning and iteration are necessary. Ultimately, a data-driven, logical analysis report that combines business sense is presented to the user.
When building the product, we also considered several points:
1. Regarding agent task planning, how can users trust our actions and the breakdown of tasks?
We will present the specific steps of task breakdown, informing users of each step’s approach and whether the final task has been completed. Users will clearly understand how the large model assists in execution. For instance, in metric queries, the queried metrics and dimensions can be fed back to clients in colloquial or textual forms.
We have thought about this level; if we provide the underlying SQL to clients, not all clients understand code or SQL, making it a black box for them. Therefore, Shushi Technology’s products can present more colloquial or textual content, making it more trustworthy for clients at the understanding level.
2. For the presentation of designs and tables, Shushi Technology adopts a combination of LUI and GUI. Users can also achieve interactive chart transformations, filtering, and selection.
3. In terms of attribution, we not only leverage small model attribution algorithms to assist the large model in collaborative problem-solving but also present the overall results. For instance, providing a summary of related text helps clients avoid confusion when querying data regarding specific data meanings and how to drill down.
4. Regarding report interpretation, we will utilize prompts for template learning, enabling the model to generate similar report summaries based on reference templates to present to clients, who can also download and forward them.
03
Specific Case Studies
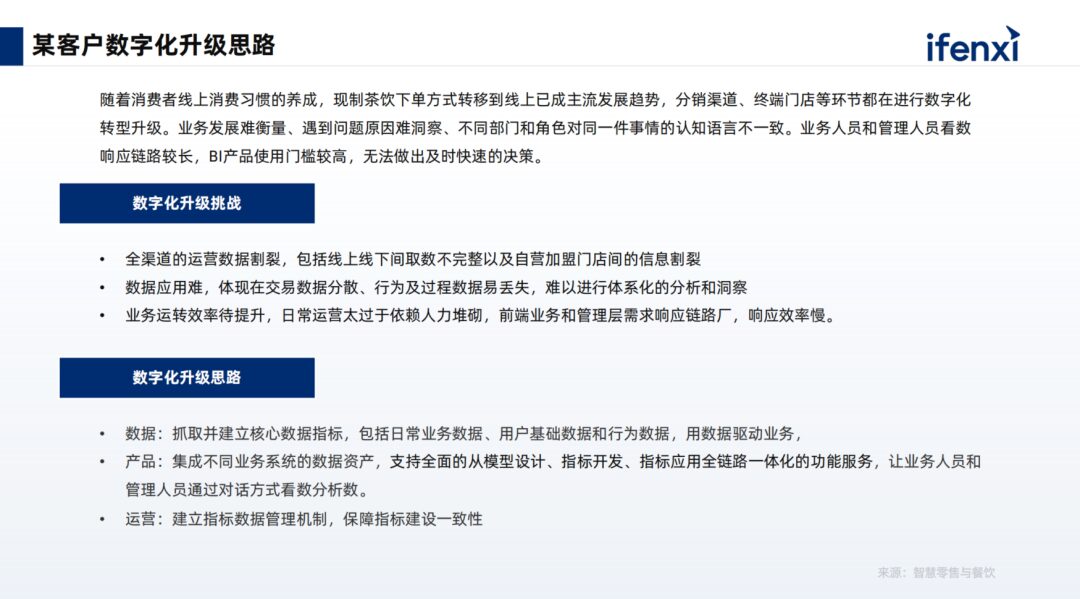
A client undergoing digital transformation faced demands from store managers and supervisors across multiple locations to view or analyze data, but struggled due to insufficient capabilities. In such enterprises, those with data analysis skills are often far removed from frontline operations, making real-time data analysis for each store difficult to achieve. Over time, this hampers the extraction of data value for business development, as headquarters cannot grasp the operational status of various stores, making intelligent decision-making challenging. Additionally, BI products have a relatively high usage threshold, and some data fields are completely incomprehensible to store managers and supervisors, complicating the viewing of data, let alone its effective utilization.
To address the above situation and challenges for achieving digital transformation, there are several major challenges:
1. Business operations occur both online and offline, leading to incomplete enterprise data and fragmented information among franchise stores, scattered across various systems, with inconsistent data metrics;
2. The application of non-unified data is relatively complex. Different systems face data loss regarding behaviors, processes, customer profiles, tags, etc., making it difficult to form systematic analyses;
3. When viewing and analyzing data to support decision-making, overall efficiency is low, requiring significant manpower and analysis personnel to support decision-making processes, resulting in slow response times.
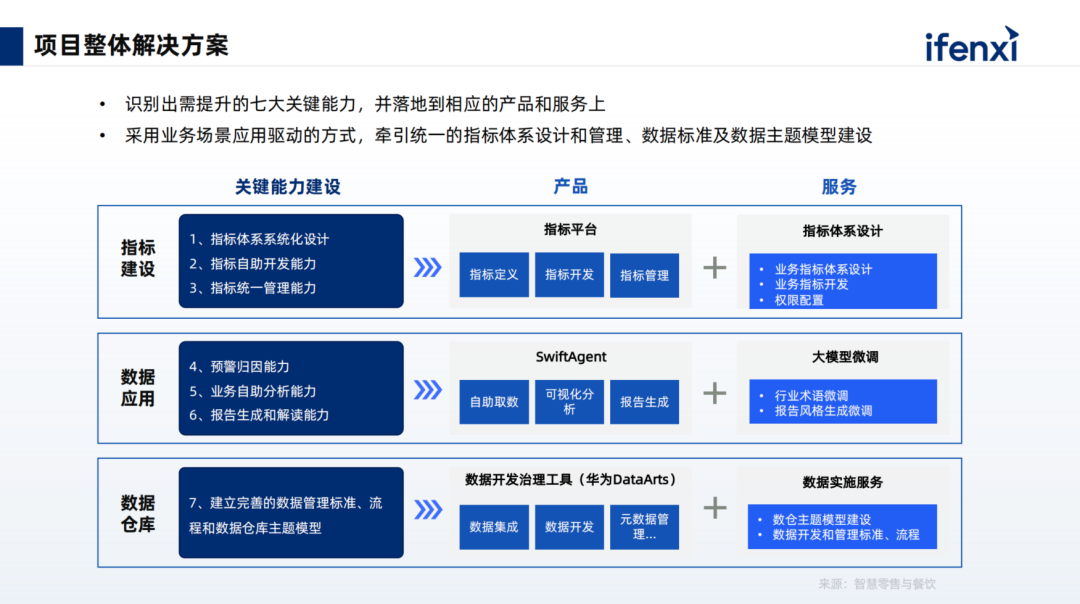
Based on the problem-solving ideas illustrated above, our overall approach to building a metric system is as follows:
1. Establish a systematic metric framework while developing self-service metrics, including definitions and management-related functionalities.
2. Attribution, self-service business analysis, report generation, and interpretation. This part will be integrated into conversational analysis products, allowing users to perform data retrieval and analysis through queries and generate reports.
3. For the underlying data, establish complete data management standards, including processes and overall models of the data warehouse, ensuring data consistency and eliminating issues related to dirty, chaotic, and poor-quality data.
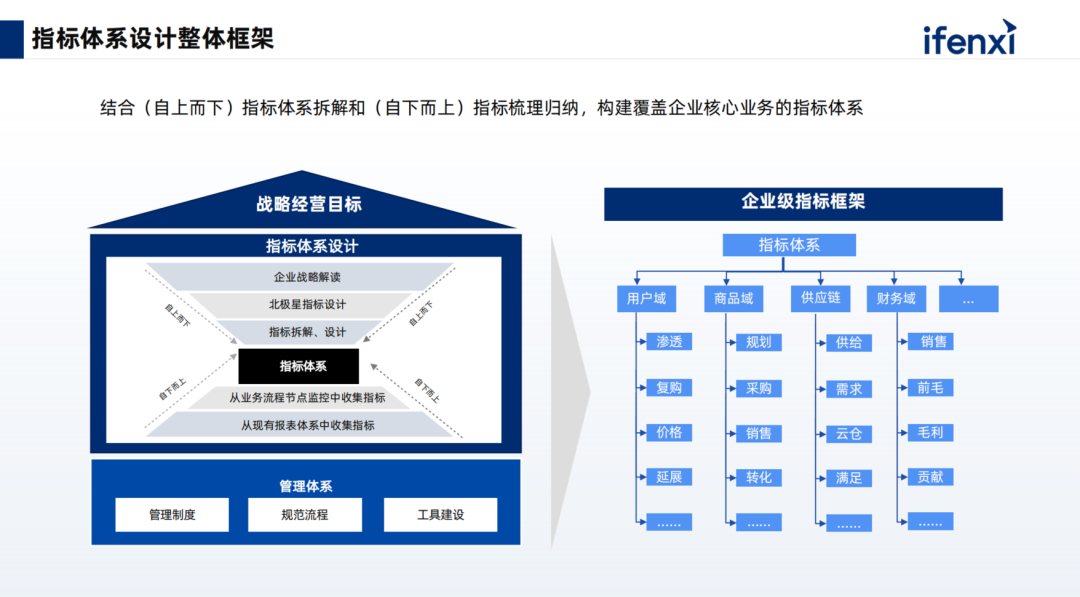
During the metric system design phase, we provided consulting services to the enterprise, breaking down and organizing the metric system from top to bottom to construct an overall metric framework. The metric framework will also be divided into different domains, each containing various types of metrics, achieving a unified understanding of the design across the enterprise, including consistency in viewing and retrieving data.
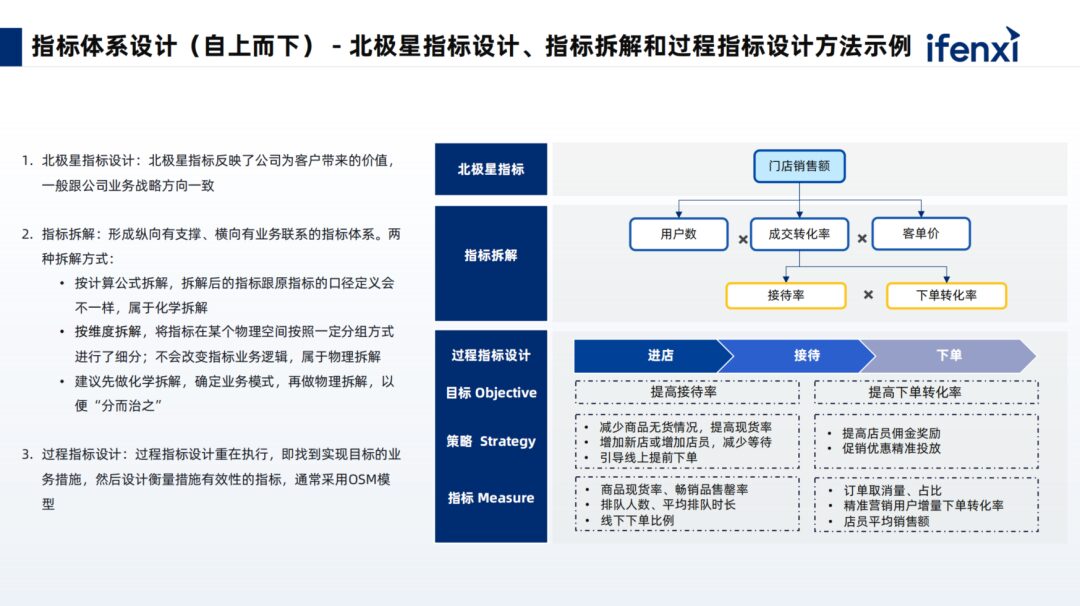
For the top-down design, we first determine what the enterprise’s North Star metric is for the year. Store sales are a focal point, forming a vertically supported and horizontally connected metric system, then defining the business model, and finally performing a physical breakdown, creating a divide-and-conquer approach.
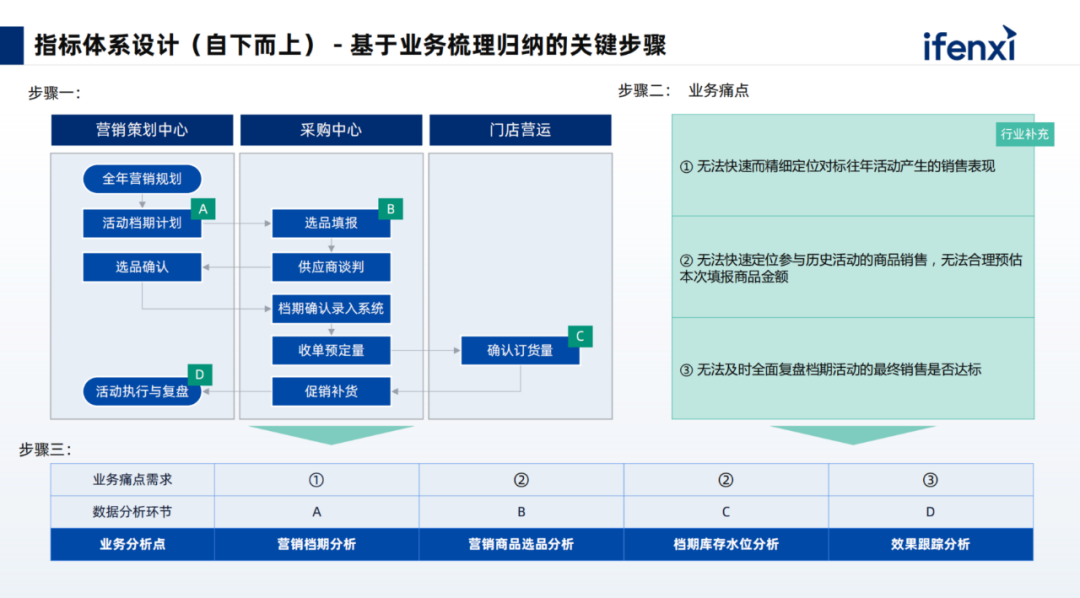
Through a bottom-up approach, we analyze the internal data assets of the enterprise, ensuring that the enterprise’s assets are utilized effectively without waste. We will review existing data tables, reports, and commonly used fields and metrics, integrating this information into the current metric system design.
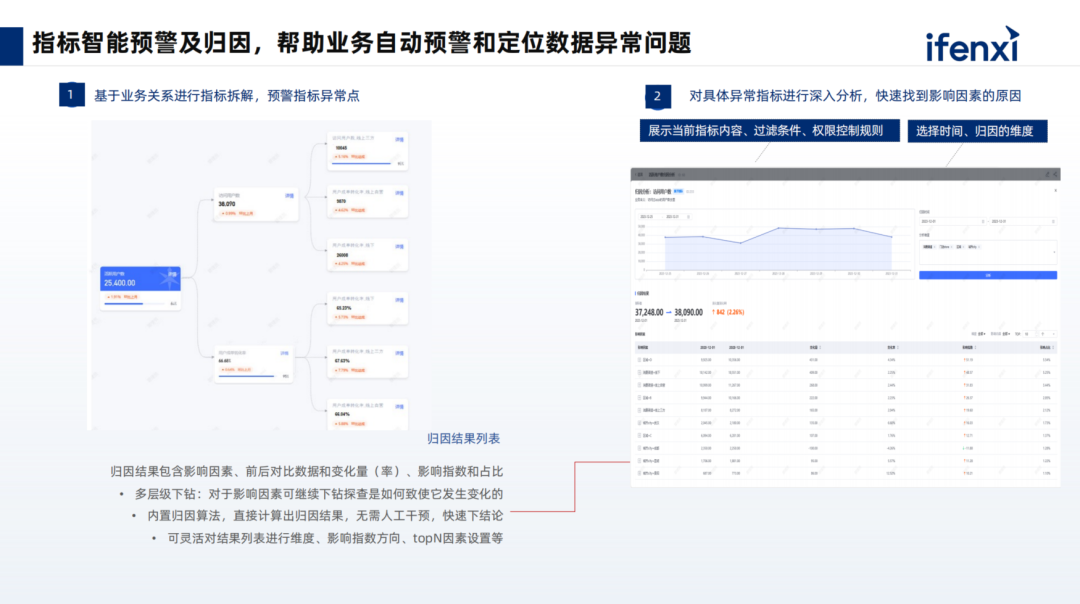
Viewing data is just the first step; conducting attribution analysis and predicting future growth trends to support decision-making is the ultimate goal. In this area, we assist enterprises in building relevant capabilities with small models, which will ultimately be integrated into the entire product system and placed in a tool pool, allowing the large model’s capabilities to be fully leveraged during planning.
The product built by Shushi Technology for this client visualizes the execution process for business, helping clients understand task execution, ultimately producing composite data reports that present core elements to assist relevant decision-making.
This concludes our sharing today. For the full video recording and slides from the expert, please scan the code to receive them.
⩓
Long press the QR code to receive the full video recording and slides.

Li Fei, Head of AI at Shushi Technology, responsible for agent development, large model capability construction, and data analysis algorithms. He has won the second prize in the Hicool Global Competition and other honors, and has published dozens of international journal articles and algorithm patents.
Note: Click the lower left corner “Read the Original” to receive the full video recording and shared slides..