
1
Installing Valgrind
-
First, extract the source package
tar xjf valgrind-3.13.0.tar.bz2
-
Enter the extracted directory and execute the configuration file
cd valgrind-3.13.0/
./configure
checking for a BSD-compatible install... /usr/bin/install -c
checking whether build environment is sane... yes
checking for a thread-safe mkdir -p... /bin/mkdir -p
checking for gawk... gawk
checking whether make sets $(MAKE)... yes
checking whether make supports nested variables... yes
checking whether to enable maintainer-specific portions of Makefiles... no
checking whether ln -s works... yes
...
-
After successful configuration, execute make to compile
make
-
Then install it
make install
2
Memory Leak Detection
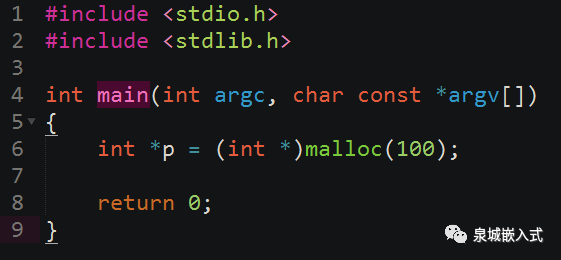
gcc test1.c -g -o test1
$ valgrind --tool=memcheck --leak-check=full ./test1
==2473== Memcheck, a memory error detector
==2473== Copyright (C) 2002-2017, and GNU GPL'd, by Julian Seward et al.
==2473== Using Valgrind-3.13.0 and LibVEX; rerun with -h for copyright info
==2473== Command: ./test1
==2473==
==2473==
==2473== HEAP SUMMARY:
==2473==     in use at exit: 100 bytes in 1 blocks
==2473==   total heap usage: 1 allocs, 0 frees, 100 bytes allocated
==2473==
==2473== 100 bytes in 1 blocks are definitely lost in loss record 1 of 1
==2473==    at 0x4C2DBF6: malloc (vg_replace_malloc.c:299)
==2473==    by 0x40053E: main (test1.c:6)
==2473==
==2473== LEAK SUMMARY:
==2473==    definitely lost: 100 bytes in 1 blocks
==2473==    indirectly lost: 0 bytes in 0 blocks
==2473==      possibly lost: 0 bytes in 0 blocks
==2473==    still reachable: 0 bytes in 0 blocks
==2473==         suppressed: 0 bytes in 0 blocks
==2473==
==2473== For counts of detected and suppressed errors, rerun with: -v
==2473== ERROR SUMMARY: 1 errors from 1 contexts (suppressed: 0 from 0)
3
Detection of Misusing Uninitialized Variables
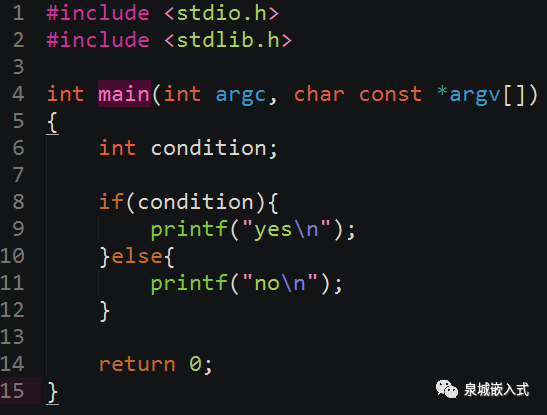
gcc test2.c -g -o test2
$ valgrind ./test2
==5814== Memcheck, a memory error detector
==5814== Copyright (C) 2002-2017, and GNU GPL'd, by Julian Seward et al.
==5814== Using Valgrind-3.13.0 and LibVEX; rerun with -h for copyright info
==5814== Command: ./test2
==5814==
==5814== Conditional jump or move depends on uninitialised value(s)
==5814==    at 0x400539: main (test2.c:8)
4
Memory Access Out Of Bounds Detection
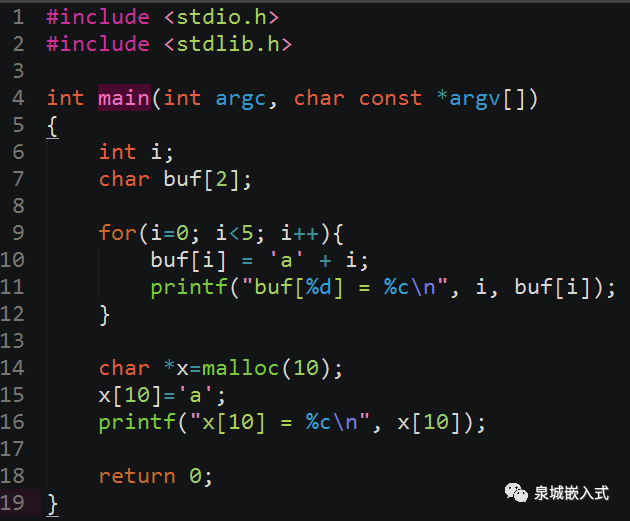
$ ./test3
buf[0] = a
buf[1] = b
buf[2] = c
buf[3] = d
buf[4] = e
x[10] = a
$ valgrind ./test3
==8528== Invalid write of size 1
==8528==    at 0x40064F: main (test3.c:15)
==8528==  Address 0x520448a is 0 bytes after a block of size 10 alloc'd
==8528==    at 0x4C2DBF6: malloc (vg_replace_malloc.c:299)
==8528==    by 0x400642: main (test3.c:14)
==8528==
==8528== Invalid read of size 1
==8528==    at 0x40065A: main (test3.c:16)
==8528==  Address 0x520448a is 0 bytes after a block of size 10 alloc'd
==8528==    at 0x4C2DBF6: malloc (vg_replace_malloc.c:299)
==8528==    by 0x400642: main (test3.c:14)
==8528==
5
Using the Massif Tool
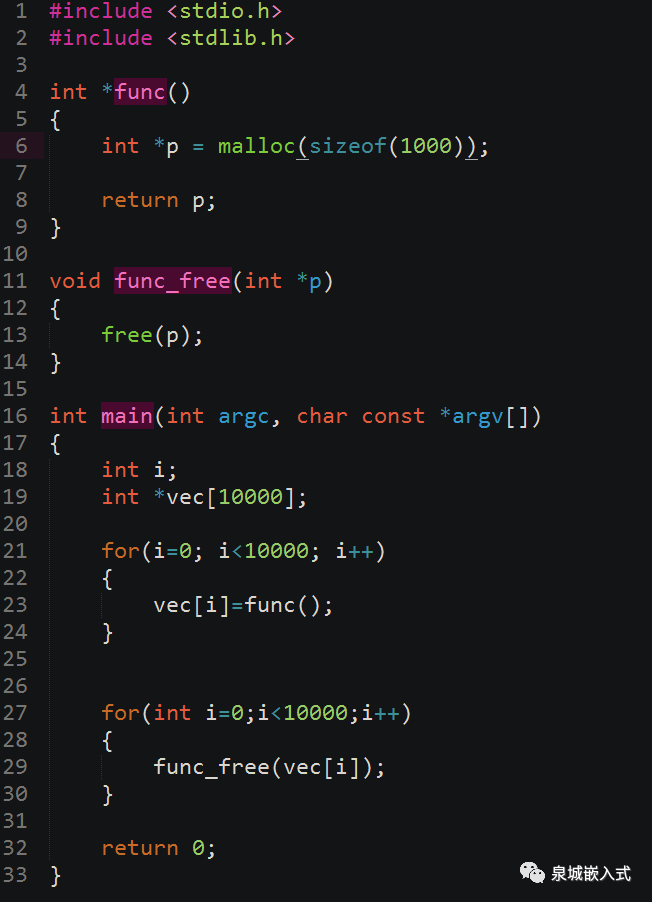
$ valgrind --tool=massif ./test4
==10727== Massif, a heap profiler
==10727== Copyright (C) 2003-2017, and GNU GPL'd, by Nicholas Nethercote
==10727== Using Valgrind-3.13.0 and LibVEX; rerun with -h for copyright info
==10727== Command: ./test4
==10727==
==10727==
ms_print massif.out.10727
ms_print massif.out.10727 > log.txt
--------------------------------------------------------------------------------
Command:            ./test4
Massif arguments:   (none)
ms_print arguments: massif.out.10727
--------------------------------------------------------------------------------


    KB
234.4^                                        #
     |                                       :#:
     |                                     :::#:::
     |                                   :::::#::::@
     |                                  ::::::#::::@:
     |                                ::::::::#::::@:::
     |                              ::::::::::#::::@::::
     |                             :::::::::::#::::@::::::
     |                           :::::::::::::#::::@::::::::
     |                         :@:::::::::::::#::::@:::::::::
     |                        ::@:::::::::::::#::::@:::::::::@:
     |                       :::@:::::::::::::#::::@:::::::::@::
     |                     :@:::@:::::::::::::#::::@:::::::::@::::
     |                   :::@:::@:::::::::::::#::::@:::::::::@::::::
     |                 @::::@:::@:::::::::::::#::::@:::::::::@::::::@
     |               ::@::::@:::@:::::::::::::#::::@:::::::::@::::::@:
     |              :::@::::@:::@:::::::::::::#::::@:::::::::@::::::@:::
     |            :::::@::::@:::@:::::::::::::#::::@:::::::::@::::::@:::::
     |          :::::::@::::@:::@:::::::::::::#::::@:::::::::@::::::@::::::@
     |         @:::::::@::::@:::@:::::::::::::#::::@:::::::::@::::::@::::::@:
   0 +----------------------------------------------------------------------->Mi
     0                                                                   0.998

Number of snapshots: 83
 Detailed snapshots: [2, 4, 13, 18, 23, 39 (peak), 44, 58, 68, 78]

--------------------------------------------------------------------------------
  n        time(i)         total(B)   useful-heap(B) extra-heap(B)    stacks(B)
--------------------------------------------------------------------------------
  0              0                0                0             0            0
  1        102,636               24                4            20            0
  2        112,338            4,776              796         3,980            0
16.67% (796B) (heap allocation functions) malloc/new/new[], --alloc-fns, etc.
->16.67% (796B) 0x4005E6: func (test4.c:6)
  ->16.67% (796B) 0x400648: main (test4.c:23)

--------------------------------------------------------------------------------
  n        time(i)         total(B)   useful-heap(B) extra-heap(B)    stacks(B)
--------------------------------------------------------------------------------
  3        124,882           10,920            1,820         9,100            0
  4        141,738           19,176            3,196        15,980            0
16.67% (3,196B) (heap allocation functions) malloc/new/new[], --alloc-fns, etc.
->16.67% (3,196B) 0x4005E6: func (test4.c:6)
  ->16.67% (3,196B) 0x400648: main (test4.c:23)

--------------------------------------------------------------------------------
  n        time(i)         total(B)   useful-heap(B) extra-heap(B)    stacks(B)
--------------------------------------------------------------------------------
  5        154,282           25,320            4,220        21,100            0
  6        166,826           31,464            5,244        26,220            0
  7        179,370           37,608            6,268        31,340            0
  8        191,914           43,752            7,292        36,460            0
  9        204,458           49,896            8,316        41,580            0
  10        217,002           56,040            9,340        46,700            0
  11        229,546           62,184           10,364        51,820            0
  12        242,090           68,328           11,388        56,940            0
  13        259,338           76,776           12,796        63,980            0
16.67% (12,796B) (heap allocation functions) malloc/new/new[], --alloc-fns, etc.
->16.67% (12,796B) 0x4005E6: func (test4.c:6)
  ->16.67% (12,796B) 0x400648: main (test4.c:23)

--------------------------------------------------------------------------------
  n        time(i)         total(B)   useful-heap(B) extra-heap(B)    stacks(B)
--------------------------------------------------------------------------------
  14        271,882           82,920           13,820        69,100            0
  15        284,426           89,064           14,844        74,220            0
  16        296,970           95,208           15,868        79,340            0
  17        309,514          101,352           16,892        84,460            0
  18        322,058          107,496           17,916        89,580            0
16.67% (17,916B) (heap allocation functions) malloc/new/new[], --alloc-fns, etc.
->16.67% (17,916B) 0x4005E6: func (test4.c:6)
  ->16.67% (17,916B) 0x400648: main (test4.c:23)

--------------------------------------------------------------------------------
  n        time(i)         total(B)   useful-heap(B) extra-heap(B)    stacks(B)
--------------------------------------------------------------------------------
  19        334,602          113,640           18,940        94,700            0
  20        347,146          119,784           19,964        99,820            0
  21        359,690          125,928           20,988       104,940            0
  22        372,234          132,072           22,012       110,060            0
  23        384,778          138,216           23,036       115,180            0
16.67% (23,036B) (heap allocation functions) malloc/new/new[], --alloc-fns, etc.
->16.67% (23,036B) 0x4005E6: func (test4.c:6)
  ->16.67% (23,036B) 0x400648: main (test4.c:23)

--------------------------------------------------------------------------------
  n        time(i)         total(B)   useful-heap(B) extra-heap(B)    stacks(B)
--------------------------------------------------------------------------------
  24        397,322          144,360           24,060       120,300            0
  25        409,866          150,504           25,084       125,420            0
  26        422,410          156,648           26,108       130,540            0
  27        434,954          162,792           27,132       135,660            0
  28        447,498          168,936           28,156       140,780            0
  29        460,042          175,080           29,180       145,900            0
  30        472,586          181,224           30,204       151,020            0
  31        485,130          187,368           31,228       156,140            0
  32        497,674          193,512           32,252       161,260            0
  33        510,218          199,656           33,276       166,380            0
  34        522,762          205,800           34,300       171,500            0
  35        535,306          211,944           35,324       176,620            0
  36        547,850          218,088           36,348       181,740            0
  37        560,394          224,232           37,372       186,860            0
  38        572,938          230,376           38,396       191,980            0
  39        593,642          240,000           40,000       200,000            0
16.67% (40,000B) (heap allocation functions) malloc/new/new[], --alloc-fns, etc.
->16.67% (40,000B) 0x4005E6: func (test4.c:6)
  ->16.67% (40,000B) 0x400648: main (test4.c:23)

--------------------------------------------------------------------------------
  n        time(i)         total(B)   useful-heap(B) extra-heap(B)    stacks(B)
--------------------------------------------------------------------------------
  40        606,246          233,400           38,900       194,500            0
  41        618,850          226,824           37,804       189,020            0
  42        631,454          220,248           36,708       183,540            0
  43        644,058          213,672           35,612       178,060            0
  44        656,662          207,096           34,516       172,580            0
16.67% (34,516B) (heap allocation functions) malloc/new/new[], --alloc-fns, etc.
->16.67% (34,516B) 0x4005E6: func (test4.c:6)
  ->16.67% (34,516B) 0x400648: main (test4.c:23)

--------------------------------------------------------------------------------
  n        time(i)         total(B)   useful-heap(B) extra-heap(B)    stacks(B)
--------------------------------------------------------------------------------
  45        669,266          200,520           33,420       167,100            0
  46        681,870          193,944           32,324       161,620            0
  47        694,474          187,368           31,228       156,140            0
  48        707,078          180,792           30,132       150,660            0
  49        725,984          170,928           28,488       142,440            0
  50        735,690          165,864           27,644       138,220            0
  51        745,396          160,800           26,800       134,000            0
  52        755,102          155,736           25,956       129,780            0
  53        764,808          150,672           25,112       125,560            0
  54        774,514          145,608           24,268       121,340            0
  55        784,220          140,544           23,424       117,120            0
  56        793,926          135,480           22,580       112,900            0
  57        803,632          130,416           21,736       108,680            0
  58        813,338          125,352           20,892       104,460            0
16.67% (20,892B) (heap allocation functions) malloc/new/new[], --alloc-fns, etc.
->16.67% (20,892B) 0x4005E6: func (test4.c:6)
  ->16.67% (20,892B) 0x400648: main (test4.c:23)

--------------------------------------------------------------------------------
  n        time(i)         total(B)   useful-heap(B) extra-heap(B)    stacks(B)
--------------------------------------------------------------------------------
  59        823,044          120,288           20,048       100,240            0
  60        832,750          115,224           19,204        96,020            0
  61        842,456          110,160           18,360        91,800            0
  62        852,162          105,096           17,516        87,580            0
  63        861,868          100,032           16,672        83,360            0
  64        871,574           94,968           15,828        79,140            0
  65        881,280           89,904           14,984        74,920            0
  66        890,986           84,840           14,140        70,700            0
  67        900,692           79,776           13,296        66,480            0
  68        910,398           74,712           12,452        62,260            0
16.67% (12,452B) (heap allocation functions) malloc/new/new[], --alloc-fns, etc.
->16.67% (12,452B) 0x4005E6: func (test4.c:6)
  ->16.67% (12,452B) 0x400648: main (test4.c:23)

--------------------------------------------------------------------------------
  n        time(i)         total(B)   useful-heap(B) extra-heap(B)    stacks(B)
--------------------------------------------------------------------------------
  69        920,104           69,648           11,608        58,040            0
  70        929,810           64,584           10,764        53,820            0
  71        939,516           59,520            9,920        49,600            0
  72        949,222           54,456            9,076        45,380            0
  73        958,928           49,392            8,232        41,160            0
  74        968,634           44,328            7,388        36,940            0
  75        978,340           39,264            6,544        32,720            0
  76        988,046           34,200            5,700        28,500            0
  77        997,752           29,136            4,856        24,280            0
  78      1,007,458           24,072            4,012        20,060            0
16.67% (4,012B) (heap allocation functions) malloc/new/new[], --alloc-fns, etc.
->16.67% (4,012B) 0x4005E6: func (test4.c:6)
  ->16.67% (4,012B) 0x400648: main (test4.c:23)

--------------------------------------------------------------------------------
  n        time(i)         total(B)   useful-heap(B) extra-heap(B)    stacks(B)
--------------------------------------------------------------------------------
  79      1,017,164           19,008            3,168        15,840            0
  80      1,026,870           13,944            2,324        11,620            0
  81      1,036,576            8,880            1,480         7,400            0
  82      1,046,282            3,816              636         3,180            0
6
Using Valgrind on Development Boards
tar xjf valgrind-3.13.0.tar.bz2
cd valgrind-3.13.0/
mkdir install
./configure --host=arm-linux  --prefix=$PWD/install
make
make install
valgrind-3.13.0/install/bin$ ls
callgrind_annotate  cg_annotate  cg_merge  valgrind            valgrind-listener
callgrind_control   cg_diff      ms_print  valgrind-di-server  vgdb
valgrind:  Fatal error at startup: a function redirection
valgrind:  which is mandatory for this platform-tool combination
valgrind:  cannot be set up.  Details of the redirection are:
valgrind:
valgrind:  A must-be-redirected function
valgrind:  whose name matches the pattern:      strcmp
valgrind:  in an object with soname matching:   ld-linux-armhf.so.3
valgrind:  was not found whilst processing
valgrind:  symbols from the object with soname: ld-linux-armhf.so.3
valgrind:
valgrind:  Possible fixes: (1, short term): install glibc's debuginfo
valgrind:  package on this machine.  (2, longer term): ask the packagers
valgrind:  for your Linux distribution to please in future ship a non-
valgrind:  stripped ld.so (or whatever the dynamic linker .so is called)
valgrind:  that exports the above-named function using the standard
valgrind:  calling conventions for this platform.  The package you need
valgrind:  to install for fix (1) is called
valgrind:
valgrind:    On Debian, Ubuntu:                 libc6-dbg
valgrind:    On SuSE, openSuSE, Fedora, RHEL:   glibc-debuginfo
valgrind:
valgrind:  Note that if you are debugging a 32 bit process on a
valgrind:  64 bit system, you will need a corresponding 32 bit debuginfo
valgrind:  package (e.g. libc6-dbg:i386).
valgrind:
valgrind:  Cannot continue -- exiting now.  Sorry.
END
Recommended Reading:

Embedded Linux
Scan the QR code to follow my public account