

The author of this article is Jean J. Labrosse, founder of Micrium and chief consultant for the Micrium product line, responsible for ensuring compliance with strict policies and standards. Jean J. Labrosse has a profound understanding of embedded systems and has authored the μC/OS series of books, which have garnered widespread attention in China!

Embedded software developers are very familiar with using code editors, compilers, linkers, debuggers, and evaluation boards. In most cases, these tools cover all the requirements for developing and debugging embedded systems. But what if you want to verify the operation of dynamic systems such as motion control, process control, chemical processes, flight systems, etc.? Modern processors have specialized debugging hardware that allows tools to display or change memory locations at runtime. Let’s explore how to use such debugging hardware to help visualize the state of embedded systems with minimal or no CPU intervention while the target is running.
If you have been designing embedded systems for a while, you know the complexity of devices and the difficulty of debugging. Microcontrollers (MCUs) are independent devices (black boxes) with on-chip memory that contain hundreds or even thousands of registers to control the operation of various peripherals (see Figure 1).

Figure 1 What can you see from the black box?
As shown in Figure 2, each toolchain comes with a debugger that at least allows you to stop the target and inspect variables and I/O registers (in the watch window). While this is very useful when debugging algorithms without real-time components, it becomes somewhat useless when you cannot stop the target (for example, in motor control, process control, etc.).

Figure 2 Window in Eclipse environment
To monitor whether the running embedded system is functioning correctly, developers often add some code to monitor the system’s operation:
LED
Embedded system developers usually have access to at least one LED that can be used to indicate that something is working; when the LED turns green, the CPU sets it to main() or some other point of interest. LEDs are great for indicating go/no-go status. However, if you want to verify the status of other operations, you need more LEDs; otherwise, you must use the single LED creatively, such as using different on/off times and blinking rates to represent different meanings.
7-Segment Display
Low-cost embedded systems may come equipped with LED or LCD 7-segment displays for end users, as shown in Figure 3. Embedded engineers can use the display to indicate what is happening in the embedded system during development. The 7-segment display can show binary, decimal, hexadecimal, or even letters. This usually depends on the range of values you have based on the number of bits. Additionally, if you want to display different values, you need to cycle through the display. If your embedded design does not require a display, you can add one solely for testing purposes. Of course, you will need to write code for this.

Figure 3 4-digit 7-segment display
Character Module
Character modules (LED or LCD) are relatively low-cost devices that can be used as debugging tools (see Figure 4). The module can be connected via a parallel port (requiring 6 to 10 output lines) or a serial interface (usually UART). Character modules can be configured in 1×8 (1 row × 8 columns) up to 4×40. These displays are easy to use and allow the display of alphabetic characters. Similar to 7-segment technology, code needs to be written to format and position the variables of interest, and if the chosen display does not have enough characters to meet your needs, you can choose different values. Character modules also have the added benefit of being able to display bar graphs.

Figure 4 4×20 Character Module
printf() Function
In my opinion, the printf() function is an overused debugging feature, which has its own set of problems. Whenever you want to display an event occurrence or show the value of a variable, you must format the string, rebuild the code, download, and restart the application. The printf() output is usually sent to the debugger’s text console, RS-232C port, or USB. Once the number of displayable lines is reached, the display scrolls, which can be cumbersome. printf() not only requires a considerable amount of code but may also impact the real-time performance of the system.
Graphic Display
If your final product includes a graphic display, you can use it during debugging to show a lot of data or even graphics. However, the debugging code will eventually be discarded or hidden in the release version of your code. Graphic libraries require tens to hundreds of kilobytes of code space and a significant amount of RAM (depending on the display resolution), which consumes CPU resources and increases the complexity of the application, so better options should be sought.
If you attempt to display a large amount of data, the above methods are insufficient. Worse, if you forget to include some key values required by the process control application in the display, you will have to edit/compile/download and run a new version and put your application back into the “state” you were trying to observe. Moreover, while displaying data is possible, what do you do if you also need to dynamically change the setpoint, limit values, gain, offset, etc.?
Graphical Live Watch
Advanced processor cores such as ARM Cortex-M or Renesas RX are equipped with hardware debugger ports that allow direct access to memory and peripherals without any CPU intervention. In other words, you can display or change memory and I/O at runtime without writing target code.
This tool is called μC/Probe, which uses the debugger port on Cortex-M or RX MCUs and allows you to display or change the values of variables or I/O port registers while the target is running. You can display values by assigning them to graphical objects (such as gauges, digital indicators, LEDs, thermometers, etc.) and also change the values of variables by assigning them to sliders, switches, digital inputs, etc. μC/Probe can also connect to the target via RS-232C, TCP/IP, or USB, but this requires a small target-resident monitor. Segger J-Link is by far the most convenient tool with the least interference to system operation.
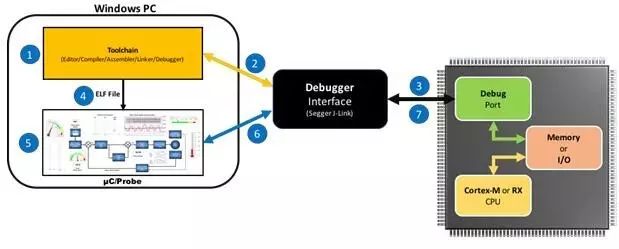
Figure 5 How Graphical Live Watch works
To monitor the values of additional variables, simply stop μC/Probe, add graphical objects, assign them to the desired variables, press the “RUN” button, and the tool will display or allow you to change these variables without the need to stop the target, edit application code, compile, download, and restart.
Next, let’s explore an example of using μC/Probe. How to observe the intermediate values of a Proportional-Integral-Derivative (PID) controller, where the controller’s update rate is 1 kHz, as shown in Figure 6. μC/Probe has a built-in 8-channel digital storage oscilloscope. Without the need to stop the target, if the variable is available in the symbol browser, it can be easily assigned to one of the channels. It can trigger on the positive or negative slope of any channel, delayed trigger, pre-trigger, post-trigger, amplify, and zoom, etc. Without μC/Probe, developers would have to extend the variable and output it to an available DAC port (if there is one) to observe these signals. This is very cumbersome, as each time you want to look at different traces, you must rebuild the application.
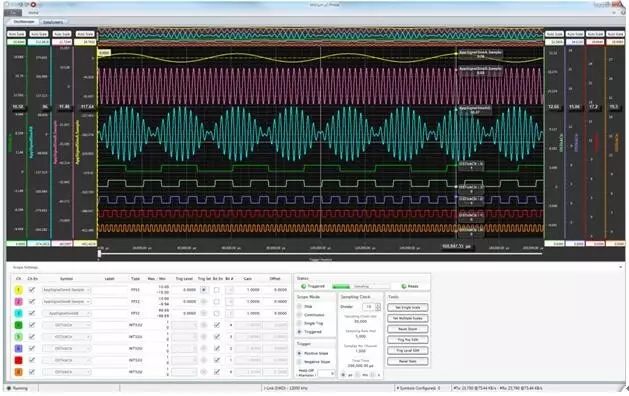
Figure 6 The built-in 8-channel digital storage oscilloscope of μC/Probe
Embedded targets can run bare-metal code or work with a Real-Time Operating System (RTOS) kernel. μC/Probe has built-in kernel awareness for popular RTOS, and of course, this information can be displayed directly, like in Figure 7. The status of each task is displayed on a single line, including its name, task priority, CPU usage, run counter, maximum interrupt disable time, maximum scheduler lock time, and the most valuable information in this view—the stack usage of each task. Specifically, one of the most challenging aspects of designing an RTOS-based embedded system is establishing the stack space required for each task. μC/Probe uses bar graphs to show the maximum stack usage for each task, quickly indicating how far they are from stack overflow.
The built-in kernel awareness of μC/Probe also allows developers to monitor the status of other kernel objects such as semaphores, mutexes, queues, timers, etc.

Figure 7 Kernel Awareness of μC/Probe
Conclusion
Testing and debugging real-time embedded software can be quite complex. In fact, it is perplexing that there are not many good tools available to make the design of embedded products easier. Any tool that allows you to instantly see what is happening inside the application is worth trying. The ideas from chip designers about providing visible multifunctional debugging interfaces in modern processors like ARM Cortex-M and Renesas RX make it easier for tools to peek into running embedded systems without interfering with the CPU. Data visualization tools like μC/Probe enable developers to confirm the correct operation of designs in embedded systems or test for anomalies that can be identified and fixed, leading many to wonder, “Why didn’t I think of having such a tool earlier?”
The promised benefits from the editor are here!
The classic Chinese version of the author’s book is presented

“Embedded Real-Time Operating System μC/OS-III” is a book published by Beihang University Press, authored by Jean J. Labrosse and reviewed by Professor Shao Beibei. μC/OS-III is a commercially available embedded real-time operating system kernel with open source code, developed from the well-known μC/OS-II. μC/OS-III is targeted at the new generation of CPUs represented by ARM Cortex, focusing on embedded applications with hardware instructions that can be used for priority lookup. μC/OS-III allows efficient task scheduling algorithms to utilize such high-end CPU hardware instructions without using μC/OS-II’s software task scheduling algorithm, and μC/OS-II supports time-slice round-robin scheduling algorithms. From the perspective of core task scheduling algorithm changes, μC/OS-III is a brand new embedded RTOS kernel. Since μC/OS, this kernel has been applied for over 20 years and has gained widespread recognition in various application fields.
Do you want to get this book? As long as you have been in contact with the μC/OS system, feel free to write down your usage experience or insights in the comment area, and we will select 6 embedded friends from there to receive this book for free!
Friendly reminder: The activity deadline is 12 PM on September 4. Once the list is determined, the editor will contact you as soon as possible, please pay attention to the replies of the selected embedded information public account.


1.Some say there are two secrets to mastering embedded development: diligence + shamelessness
2.How to make yourself look knowledgeable about artificial intelligence?
3.Let’s take you into the mysterious internal world of embedded ARM MMU
4.Which programming language should be chosen first?
5.Embedded engineers discuss which has a brighter future: hardware engineers or software engineers?
6.How embedded software engineers can transition from junior to qualified!
